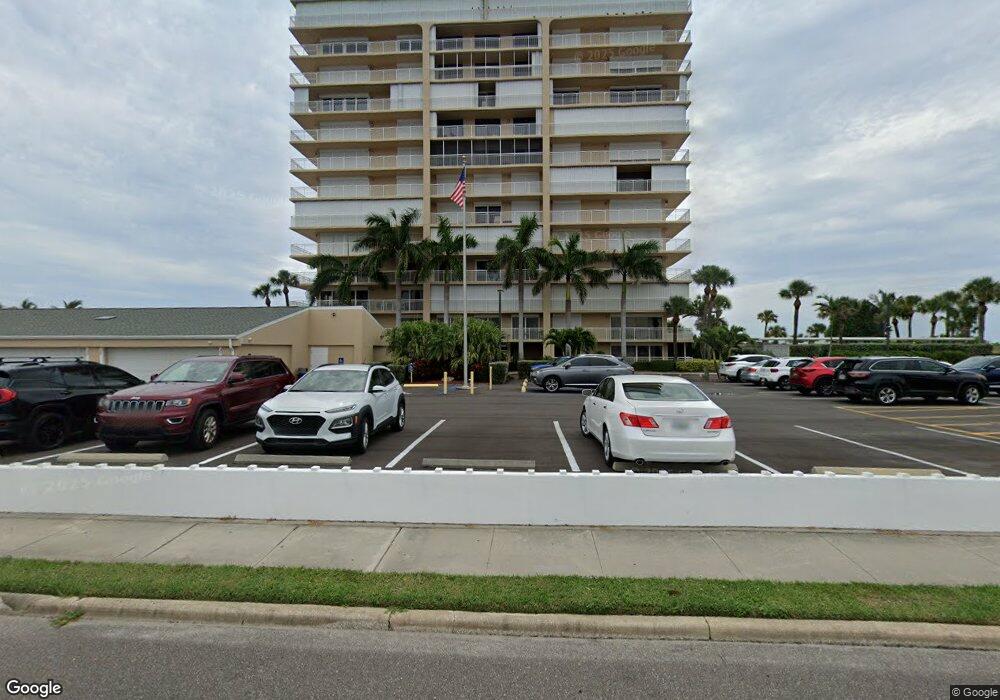
877 N A1a Hwy Unit 502 Indialantic, FL 32903
Paradise Beach NeighborhoodEstimated Value: $440,004 - $498,000
2
Beds
2
Baths
1,200
Sq Ft
$394/Sq Ft
Est. Value
About This Home
This home is located at 877 N A1a Hwy Unit 502, Indialantic, FL 32903 and is currently estimated at $472,251, approximately $393 per square foot. 877 N A1a Hwy Unit 502 is a home located in Brevard County with nearby schools including Indialantic Elementary School, Herbert C. Hoover Middle School, and Melbourne Senior High School.
Ownership History
Date
Name
Owned For
Owner Type
Purchase Details
Closed on
Feb 21, 2018
Sold by
Hawk Stephanie M
Bought by
Hawk Stephanie M and Hawk Bradley H
Current Estimated Value
Home Financials for this Owner
Home Financials are based on the most recent Mortgage that was taken out on this home.
Original Mortgage
$255,000
Interest Rate
3.99%
Mortgage Type
New Conventional
Purchase Details
Closed on
Nov 24, 2015
Sold by
Hawk Stephanie M
Bought by
Mendola Christopher Patrick and 877 Aia Trust
Purchase Details
Closed on
Feb 12, 2004
Sold by
Mendola Christopher P and Mendola Erika L
Bought by
Hawk Stephanie M
Purchase Details
Closed on
Nov 30, 2000
Sold by
Wilkins William R and Wilkins Robert C
Bought by
Mendola Christopher P and Mendola Erika L
Home Financials for this Owner
Home Financials are based on the most recent Mortgage that was taken out on this home.
Original Mortgage
$97,600
Interest Rate
7.82%
Create a Home Valuation Report for This Property
The Home Valuation Report is an in-depth analysis detailing your home's value as well as a comparison with similar homes in the area
Home Values in the Area
Average Home Value in this Area
Purchase History
| Date | Buyer | Sale Price | Title Company |
|---|---|---|---|
| Hawk Stephanie M | $127,500 | Attorney | |
| Mendola Christopher Patrick | -- | None Available | |
| Hawk Stephanie M | $90,000 | None Available | |
| Mendola Christopher P | $126,000 | -- |
Source: Public Records
Mortgage History
| Date | Status | Borrower | Loan Amount |
|---|---|---|---|
| Previous Owner | Hawk Stephanie M | $255,000 | |
| Previous Owner | Mendola Christopher P | $97,600 |
Source: Public Records
Tax History Compared to Growth
Tax History
| Year | Tax Paid | Tax Assessment Tax Assessment Total Assessment is a certain percentage of the fair market value that is determined by local assessors to be the total taxable value of land and additions on the property. | Land | Improvement |
|---|---|---|---|---|
| 2025 | $4,995 | $399,000 | -- | -- |
| 2024 | $4,890 | $409,440 | -- | -- |
| 2023 | $4,890 | $409,440 | $0 | $0 |
| 2022 | $4,161 | $354,740 | $0 | $0 |
| 2021 | $3,735 | $255,680 | $0 | $255,680 |
| 2020 | $3,777 | $255,680 | $0 | $255,680 |
| 2019 | $3,843 | $255,490 | $0 | $255,490 |
| 2018 | $3,792 | $245,000 | $0 | $245,000 |
| 2017 | $3,818 | $236,900 | $0 | $236,900 |
| 2016 | $3,715 | $219,350 | $0 | $0 |
| 2015 | $3,740 | $205,230 | $0 | $0 |
| 2014 | $3,556 | $186,580 | $0 | $0 |
Source: Public Records
Map
Nearby Homes
- 877 N Highway A1a Unit 308
- 877 N Highway A1a Unit 1208
- 877 N Highway A1a Unit 104
- 877 N Hwy A1a Hwy Unit 401
- 877 N Hwy A1a Hwy Unit 208
- 925 N Highway A1a Unit 501
- 1570 N Highway A1a
- 1760 N Highway A1a
- 989 N Highway A1a Unit 5
- 1145 N Shannon Ave Unit 29
- 107 Franklyn Ave
- 995 N Highway A1a Unit 510
- 995 N Highway A1a Unit 203
- 995 N Highway A1a
- 995 N Highway A1a Unit 103
- 601 N Miramar Ave Unit 107
- 601 N Miramar Ave Unit 110
- 225 Chalet Ave
- 137 Washington Ave Unit B
- 405 N Miramar Ave Unit Ocean Villa 1
- 877 N Highway A1a Unit 1106
- 877 N Highway A1a Unit 703
- 877 N Highway A1a Unit 408
- 877 N Highway A1a Unit 407
- 877 N Highway A1a Unit 401
- 877 N Highway A1a Unit 1003
- 877 N Highway A1a
- 877 N Highway A1a Unit 1201
- 877 N Highway A1a Unit 301
- 877 N A1a Hwy Unit 1002
- 877 N A1a Hwy
- 877 N A1a Hwy Unit 508
- 877 N Highway A1a Unit 604
- 877 N Highway A1a Unit 408
- 877 N Highway A1a Unit 608
- 877 N A1a Hwy Unit 501
- 877 N Highway A1a Unit 101
- 877 N Sr-A1a Unit 1207
- 877 N A1a Hwy Unit 107
- 877 N Highway A1a Unit 208