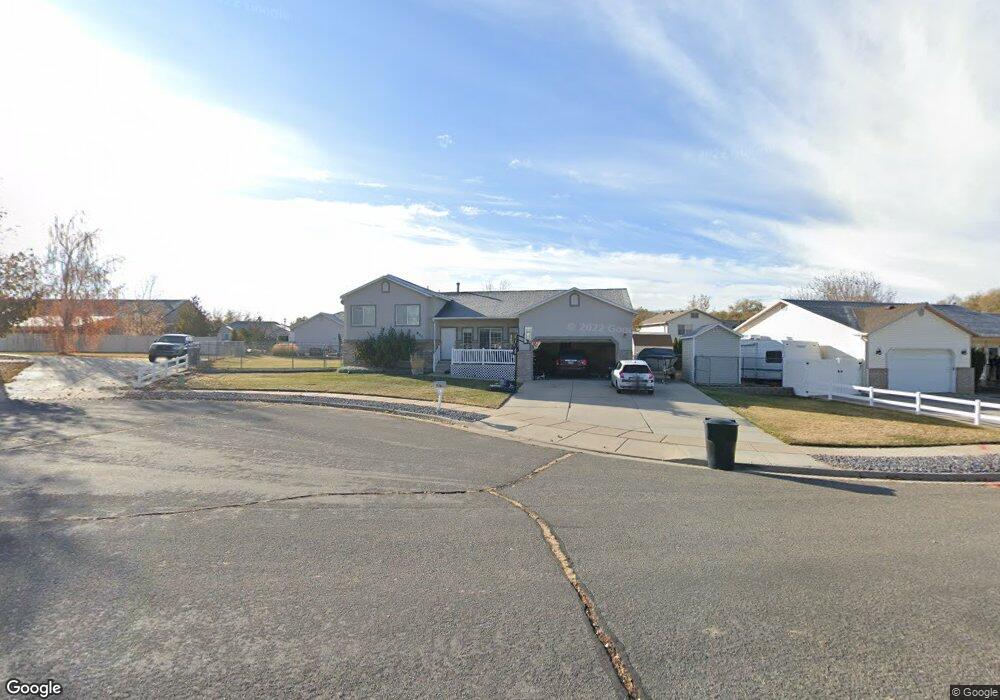
877 W 1145 N Clearfield, UT 84015
Estimated Value: $522,000 - $560,000
5
Beds
5
Baths
1,629
Sq Ft
$337/Sq Ft
Est. Value
About This Home
This home is located at 877 W 1145 N, Clearfield, UT 84015 and is currently estimated at $548,932, approximately $336 per square foot. 877 W 1145 N is a home located in Davis County with nearby schools including Clinton Elementary School, Sunset Junior High School, and Clearfield High School.
Ownership History
Date
Name
Owned For
Owner Type
Purchase Details
Closed on
Nov 20, 2018
Sold by
Pinckney Regina
Bought by
Pinckney Regina and The Regina H Pinckney Trust
Current Estimated Value
Purchase Details
Closed on
Mar 31, 2010
Sold by
Wilson Regina H and Pinckney Regina
Bought by
Pinckney Regina
Home Financials for this Owner
Home Financials are based on the most recent Mortgage that was taken out on this home.
Original Mortgage
$146,321
Outstanding Balance
$96,493
Interest Rate
4.88%
Mortgage Type
New Conventional
Estimated Equity
$452,439
Purchase Details
Closed on
Jul 28, 2007
Sold by
Wilson Walter R and Wilson Regina H
Bought by
Wilson Regina H
Purchase Details
Closed on
Jan 21, 1997
Sold by
Farr Miland R and Farr Mary E
Bought by
Wilson Walter R and Wilson Regina H
Home Financials for this Owner
Home Financials are based on the most recent Mortgage that was taken out on this home.
Original Mortgage
$123,480
Interest Rate
7.58%
Mortgage Type
Balloon
Create a Home Valuation Report for This Property
The Home Valuation Report is an in-depth analysis detailing your home's value as well as a comparison with similar homes in the area
Home Values in the Area
Average Home Value in this Area
Purchase History
| Date | Buyer | Sale Price | Title Company |
|---|---|---|---|
| Pinckney Regina | -- | None Available | |
| Pinckney Regina | -- | Bonneville Superior Titl | |
| Wilson Regina H | -- | None Available | |
| Wilson Walter R | -- | Associated Title Company |
Source: Public Records
Mortgage History
| Date | Status | Borrower | Loan Amount |
|---|---|---|---|
| Open | Pinckney Regina | $146,321 | |
| Closed | Wilson Walter R | $123,480 |
Source: Public Records
Tax History Compared to Growth
Tax History
| Year | Tax Paid | Tax Assessment Tax Assessment Total Assessment is a certain percentage of the fair market value that is determined by local assessors to be the total taxable value of land and additions on the property. | Land | Improvement |
|---|---|---|---|---|
| 2025 | $3,089 | $297,000 | $109,403 | $187,597 |
| 2024 | $2,970 | $287,099 | $118,661 | $168,438 |
| 2023 | $2,701 | $265,650 | $75,796 | $189,853 |
| 2022 | $2,902 | $522,000 | $147,101 | $374,899 |
| 2021 | $2,637 | $387,000 | $107,066 | $279,934 |
| 2020 | $2,306 | $335,000 | $94,177 | $240,823 |
| 2019 | $2,234 | $317,000 | $104,177 | $212,823 |
| 2018 | $2,030 | $283,000 | $87,249 | $195,751 |
| 2016 | $1,930 | $138,930 | $34,622 | $104,308 |
| 2015 | $1,814 | $124,135 | $34,622 | $89,513 |
| 2014 | $1,730 | $120,264 | $34,622 | $85,642 |
| 2013 | -- | $117,761 | $28,296 | $89,465 |
Source: Public Records
Map
Nearby Homes