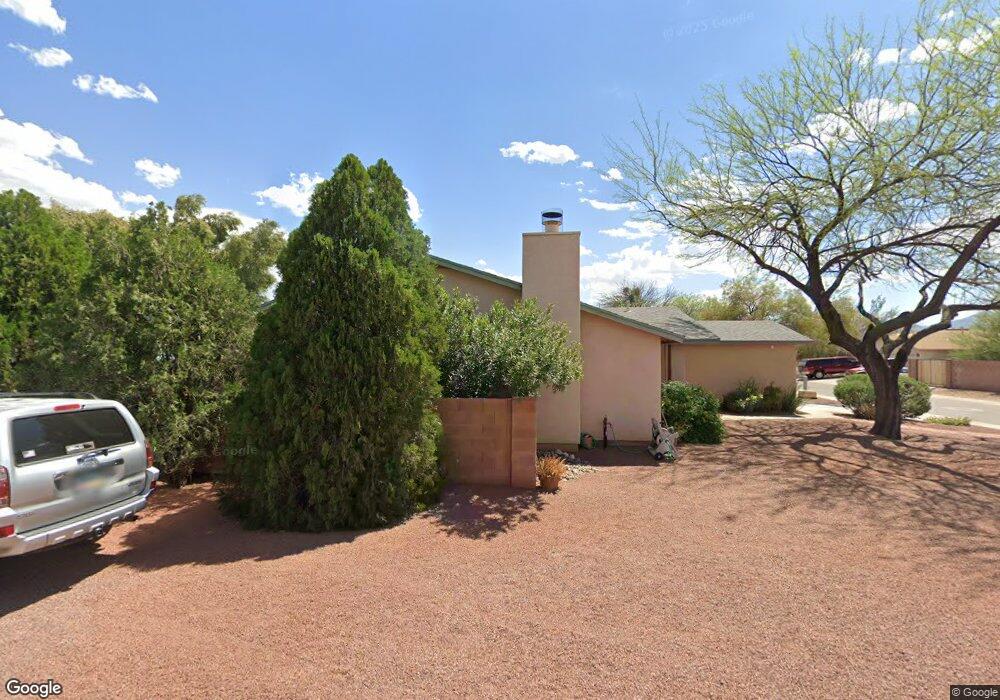
8770 N Chinaberry Way Tucson, AZ 85742
Countryside NeighborhoodEstimated Value: $279,176 - $355,000
--
Bed
2
Baths
1,686
Sq Ft
$197/Sq Ft
Est. Value
About This Home
This home is located at 8770 N Chinaberry Way, Tucson, AZ 85742 and is currently estimated at $332,044, approximately $196 per square foot. 8770 N Chinaberry Way is a home located in Pima County with nearby schools including Quail Run Elementary School, Tortolita Middle School, and Mountain View High School.
Ownership History
Date
Name
Owned For
Owner Type
Purchase Details
Closed on
Feb 20, 2018
Sold by
Bennett Stanmore
Bought by
Bennett Don Edward and Bennett Kristin Deanne
Current Estimated Value
Purchase Details
Closed on
Nov 4, 1998
Sold by
Lamb John E and Lamb Patricia W
Bought by
Bennett Stanmore and Bennett Carolyn
Home Financials for this Owner
Home Financials are based on the most recent Mortgage that was taken out on this home.
Original Mortgage
$100,000
Outstanding Balance
$21,866
Interest Rate
6.61%
Mortgage Type
Seller Take Back
Estimated Equity
$310,178
Purchase Details
Closed on
Feb 22, 1996
Sold by
Dixon Lloyd and Dixon Christine A
Bought by
Lamb John E and Lamb Patricia W
Home Financials for this Owner
Home Financials are based on the most recent Mortgage that was taken out on this home.
Original Mortgage
$85,000
Interest Rate
7.1%
Mortgage Type
New Conventional
Create a Home Valuation Report for This Property
The Home Valuation Report is an in-depth analysis detailing your home's value as well as a comparison with similar homes in the area
Home Values in the Area
Average Home Value in this Area
Purchase History
| Date | Buyer | Sale Price | Title Company |
|---|---|---|---|
| Bennett Don Edward | -- | None Available | |
| Bennett Don Edward | -- | None Available | |
| Bennett Stanmore | $118,000 | -- | |
| Lamb John E | $113,643 | Fidelity National Title |
Source: Public Records
Mortgage History
| Date | Status | Borrower | Loan Amount |
|---|---|---|---|
| Open | Bennett Stanmore | $100,000 | |
| Previous Owner | Lamb John E | $85,000 |
Source: Public Records
Tax History Compared to Growth
Tax History
| Year | Tax Paid | Tax Assessment Tax Assessment Total Assessment is a certain percentage of the fair market value that is determined by local assessors to be the total taxable value of land and additions on the property. | Land | Improvement |
|---|---|---|---|---|
| 2025 | $2,510 | $19,175 | -- | -- |
| 2024 | $2,510 | $18,262 | -- | -- |
| 2023 | $2,237 | $17,392 | $0 | $0 |
| 2022 | $2,237 | $16,564 | $0 | $0 |
| 2021 | $2,280 | $15,024 | $0 | $0 |
| 2020 | $2,155 | $15,024 | $0 | $0 |
| 2019 | $2,104 | $15,967 | $0 | $0 |
| 2018 | $2,043 | $12,978 | $0 | $0 |
| 2017 | $2,010 | $12,978 | $0 | $0 |
| 2016 | $1,899 | $12,360 | $0 | $0 |
| 2015 | $1,812 | $11,772 | $0 | $0 |
Source: Public Records
Map
Nearby Homes
- 8741 N Chinaberry Way
- 4769 W Lessing Ln
- 4781 W Snowberry Ln
- 8893 N Lessing Ct
- 4806 W Candleberry Way
- 8951 N Fitzgerald Ln
- 9000 N Twain St
- 4825 W Matilda Dr
- 4824 W Lessing Ln
- 4734 W Calatrava Ln
- 8978 N Roebling Dr
- 8470 N Snowdrop Dr
- 4606 W Lindenthal Ln
- 5007 W Hurston Dr
- 5028 W Hurston Dr
- 4860 W Cheetah St
- 4170 W Cortaro Farms Rd
- 5144 W Paytons Ct
- 8943 N Onyx St
- 8912 N Onyx St
- 8760 N Chinaberry Way
- 4639 W Hardy Rd
- 8750 N Chinaberry Way
- 4610 W Hardy Rd
- 4630 W Hardy Rd
- 4649 W Hardy Rd
- 8751 N Chinaberry Way
- 8740 N Chinaberry Way
- 4640 W Hardy Rd
- 4650 W Hardy Rd
- 4659 W Hardy Rd
- 8730 N Chinaberry Way
- 4660 W Hardy Rd
- 8760 N Huckelberry Way
- 8720 N Chinaberry Way
- 4669 W Hardy Rd
- 8721 N Chinaberry Way
- 4670 W Hardy Rd
- 8710 N Chinaberry Way
- 4680 W Hardy Rd