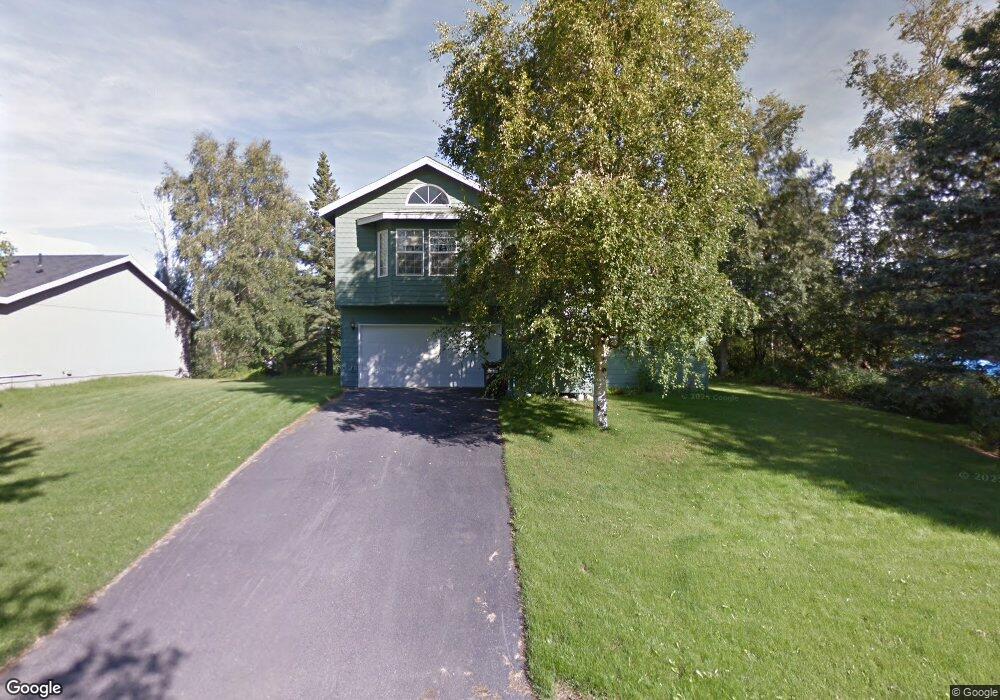
8771 E Times Square Ct Palmer, AK 99645
Gateway NeighborhoodEstimated Value: $230,000 - $404,291
3
Beds
2
Baths
1,726
Sq Ft
$201/Sq Ft
Est. Value
About This Home
This home is located at 8771 E Times Square Ct, Palmer, AK 99645 and is currently estimated at $347,073, approximately $201 per square foot. 8771 E Times Square Ct is a home located in Matanuska-Susitna Borough with nearby schools including Pioneer Peak Elementary School, Colony Middle School, and Colony High School.
Ownership History
Date
Name
Owned For
Owner Type
Purchase Details
Closed on
Aug 21, 2006
Sold by
Smith Tanja
Bought by
Smith Tanja
Current Estimated Value
Purchase Details
Closed on
Mar 6, 2004
Sold by
Stout Gregory W and Stout Tracy L
Bought by
Adank Mark A and Smith Tanja
Home Financials for this Owner
Home Financials are based on the most recent Mortgage that was taken out on this home.
Original Mortgage
$144,000
Outstanding Balance
$67,016
Interest Rate
5.61%
Mortgage Type
Purchase Money Mortgage
Estimated Equity
$280,057
Purchase Details
Closed on
Mar 28, 2002
Sold by
Considine Bernard
Bought by
Stout Gregory W and Stout Tracy L
Home Financials for this Owner
Home Financials are based on the most recent Mortgage that was taken out on this home.
Original Mortgage
$168,920
Interest Rate
6.84%
Mortgage Type
VA
Create a Home Valuation Report for This Property
The Home Valuation Report is an in-depth analysis detailing your home's value as well as a comparison with similar homes in the area
Home Values in the Area
Average Home Value in this Area
Purchase History
| Date | Buyer | Sale Price | Title Company |
|---|---|---|---|
| Smith Tanja | -- | None Available | |
| Adank Mark A | -- | -- | |
| Stout Gregory W | -- | -- |
Source: Public Records
Mortgage History
| Date | Status | Borrower | Loan Amount |
|---|---|---|---|
| Open | Adank Mark A | $144,000 | |
| Previous Owner | Stout Gregory W | $168,920 |
Source: Public Records
Tax History Compared to Growth
Tax History
| Year | Tax Paid | Tax Assessment Tax Assessment Total Assessment is a certain percentage of the fair market value that is determined by local assessors to be the total taxable value of land and additions on the property. | Land | Improvement |
|---|---|---|---|---|
| 2025 | $3,451 | $319,100 | $40,500 | $278,600 |
| 2024 | $3,451 | $305,200 | $40,500 | $264,700 |
| 2023 | $3,240 | $294,400 | $40,500 | $253,900 |
| 2022 | $3,109 | $268,800 | $40,500 | $228,300 |
| 2021 | $3,123 | $243,300 | $40,500 | $202,800 |
| 2020 | $3,040 | $228,700 | $40,500 | $188,200 |
| 2019 | $2,995 | $223,200 | $40,500 | $182,700 |
| 2018 | $2,971 | $222,100 | $40,500 | $181,600 |
| 2017 | $2,940 | $220,400 | $40,500 | $179,900 |
| 2016 | $2,781 | $214,400 | $34,500 | $179,900 |
| 2015 | $2,837 | $212,100 | $34,500 | $177,600 |
| 2014 | $2,837 | $209,800 | $34,500 | $175,300 |
Source: Public Records
Map
Nearby Homes
- 8825 E Central Pkwy
- 1970 N Broadway Dr
- 9075 E Spring Creek Cir
- 1851 N 49th State St
- 9701 E Palmer-Wasilla Hwy
- 1200 N Golden Hills Dr
- 9475 E Spring Creek Cir
- 9700 E Forest Grove Cir Unit 8A
- 1100 N Golden Hills Dr
- 2455 N Green Forest Dr
- 7786 E Reisner Loop
- 2300 N Laurel Dr
- L8 B1 N Woodside Cir
- L11 B1 E Heartland Loop
- 10457 E Heartland Loop
- L17 N Endless Cir
- 10380 E Heartland Loop
- 10404 E Heartland Loop
- L6 B1 E Heartland Loop
- L5 B1 E Heartland Loop
- 8791 E Times Square Ct
- 8791 E Times Square Cir
- 8771 E Times Square Cir
- 8751 E Times Square Ct
- 8901 Queensboro Ave
- 8801 E Times Square Cir
- L6 B5 E Times Square Cir
- 8910 E Times Square Ct
- 8751 E Times Square Cir
- 8801 E Times Square Ct
- 8788 E Times Square Cir
- 8811 E Times Square Cir
- 8731 E Times Square Ct
- 8760 E Times Square Ct
- 8721 E Queensboro Ave
- 8740 E Times Square Ct
- 8750 E Kiva Way
- 8861 E Lexington St
- 8788 E Times Square Cir
- 8760 E Times Square Cir