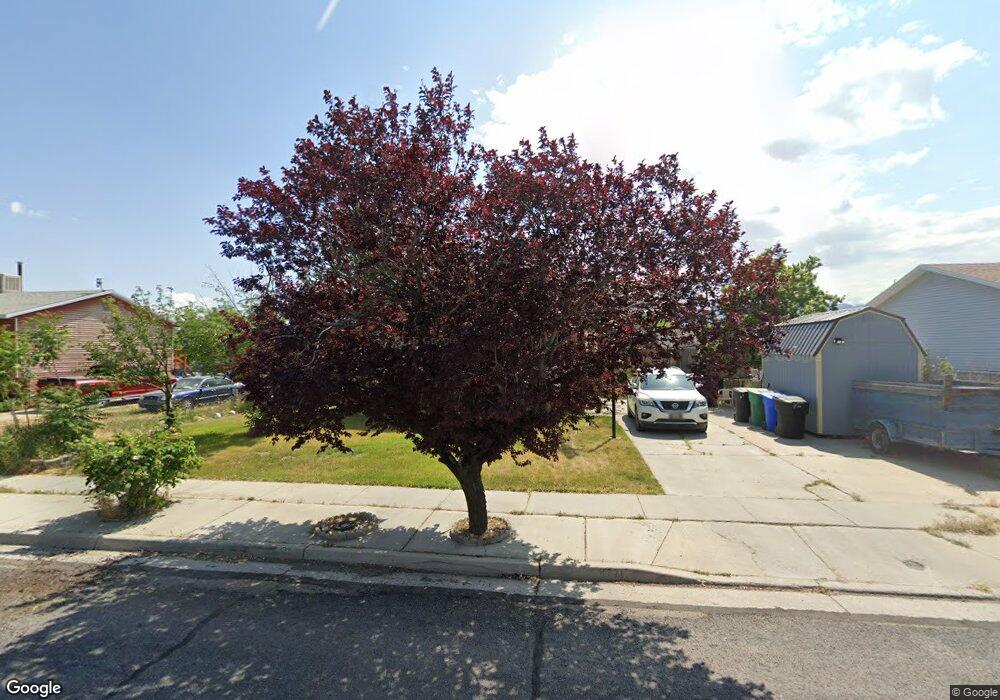
8771 S 3920 W West Jordan, UT 84088
Jordan Oaks NeighborhoodEstimated Value: $454,000 - $508,000
4
Beds
2
Baths
1,856
Sq Ft
$259/Sq Ft
Est. Value
About This Home
This home is located at 8771 S 3920 W, West Jordan, UT 84088 and is currently estimated at $480,148, approximately $258 per square foot. 8771 S 3920 W is a home located in Salt Lake County with nearby schools including Columbia Elementary School, Joel P. Jensen Middle School, and West Jordan High School.
Ownership History
Date
Name
Owned For
Owner Type
Purchase Details
Closed on
Mar 22, 2022
Sold by
Harbaugh Jared L and Harbaugh Stephanie
Bought by
Harbaugh Jared L and Harbaugh Stephanie
Current Estimated Value
Purchase Details
Closed on
Nov 1, 2017
Sold by
Harbaugh Jared L and Harbaugh Bessie M
Bought by
Harbaugh Jared L and Harbaugh Staphanie
Home Financials for this Owner
Home Financials are based on the most recent Mortgage that was taken out on this home.
Original Mortgage
$284,747
Interest Rate
3.87%
Mortgage Type
FHA
Purchase Details
Closed on
May 9, 2013
Sold by
Bair Ronnie and Bair Nancy
Bought by
Bair Ronnie L and Bair Nancy D
Home Financials for this Owner
Home Financials are based on the most recent Mortgage that was taken out on this home.
Original Mortgage
$146,564
Interest Rate
3.62%
Mortgage Type
FHA
Create a Home Valuation Report for This Property
The Home Valuation Report is an in-depth analysis detailing your home's value as well as a comparison with similar homes in the area
Home Values in the Area
Average Home Value in this Area
Purchase History
| Date | Buyer | Sale Price | Title Company |
|---|---|---|---|
| Harbaugh Jared L | -- | Amrock | |
| Harbaugh Jared L | -- | Sutherland Title | |
| Harbaugh Jared L | -- | Old Republic Title Draper/Or | |
| Bair Ronnie L | -- | First American Title |
Source: Public Records
Mortgage History
| Date | Status | Borrower | Loan Amount |
|---|---|---|---|
| Previous Owner | Harbaugh Jared L | $284,747 | |
| Previous Owner | Bair Ronnie L | $146,564 |
Source: Public Records
Tax History Compared to Growth
Tax History
| Year | Tax Paid | Tax Assessment Tax Assessment Total Assessment is a certain percentage of the fair market value that is determined by local assessors to be the total taxable value of land and additions on the property. | Land | Improvement |
|---|---|---|---|---|
| 2025 | $2,268 | $440,100 | $107,200 | $332,900 |
| 2024 | $2,268 | $436,400 | $104,100 | $332,300 |
| 2023 | $2,072 | $375,800 | $97,300 | $278,500 |
| 2022 | $2,143 | $382,300 | $95,400 | $286,900 |
| 2021 | $1,801 | $292,500 | $70,600 | $221,900 |
| 2020 | $1,818 | $277,100 | $70,600 | $206,500 |
| 2019 | $1,769 | $264,400 | $70,600 | $193,800 |
| 2018 | $1,615 | $239,400 | $66,600 | $172,800 |
| 2017 | $1,165 | $171,900 | $66,600 | $105,300 |
| 2016 | $1,167 | $161,800 | $66,600 | $95,200 |
| 2015 | $1,151 | $155,600 | $66,000 | $89,600 |
| 2014 | $1,100 | $146,400 | $62,800 | $83,600 |
Source: Public Records
Map
Nearby Homes
- 3931 W Dansere Cir
- 3888 W 8700 S
- 8983 S 3860 W
- 8400 S 4000 W Unit 134
- 8461 S Meadowlark Ln
- 8941 S Sun Leaf Dr
- 3750 W Bingham Creek Dr
- 3977 W Elwood Way
- 9375 S Laurel Ridge Cir
- 9029 S Ripple Dr
- 3702 W Angus Dr
- 3214 W Monterey Pine Ln
- 9441 S Newkirk St
- 8180 S Old Bingham Hwy
- 8493 S 3200 W
- 9353 S 4460 W
- 7991 S 3725 W
- 9526 Ember Glow Ct Unit C
- 7989 S 3725 W
- 8359 Etude Dr
- 8759 S 3920 W
- 8783 S 3920 W
- 8772 Royal Crest Dr
- 8752 S 3920 W
- 8780 Royal Crest Dr
- 8747 S 3920 W
- 3889 Stardust Cir
- 3889 W Stardust Cir
- 3908 Old Bingham Hwy
- 3908 W Old Bingham Hwy
- 3931 Dansere Cir
- 3894 W Old Bingham Hwy
- 3894 Old Bingham Hwy
- 3938 W Clavinet Cir
- 3931 Clavinet Cir
- 3931 W Clavinet Cir
- 8752 S Royal Crest Dr
- 8752 Royal Crest Dr
- 8790 Royal Crest Dr
- 8790 S Royal Crest Dr