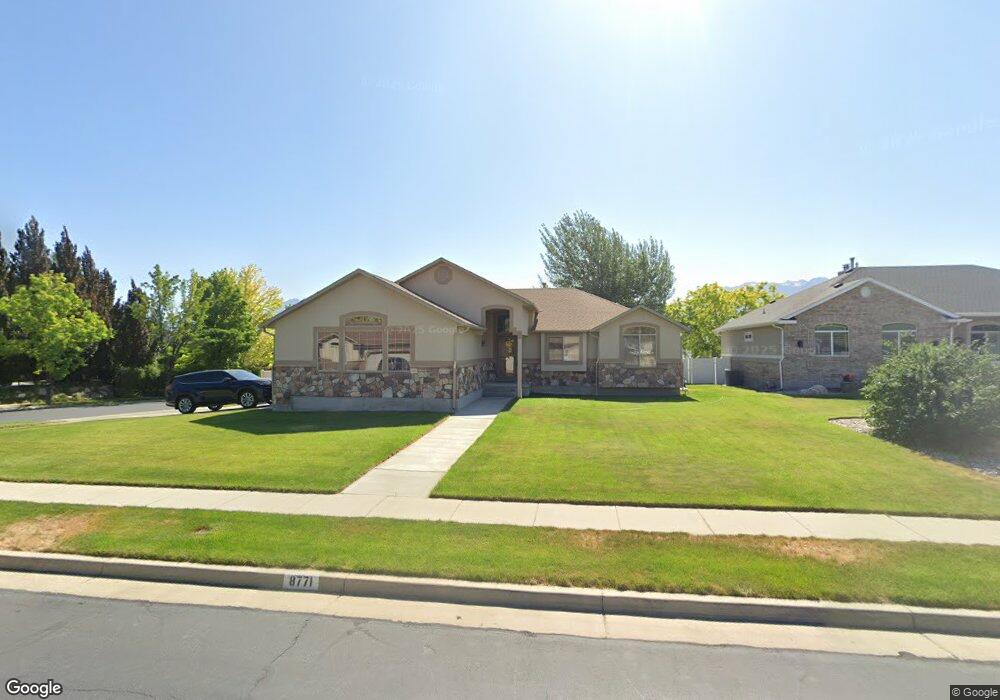
8771 Terra Pointe Way West Jordan, UT 84088
Estimated Value: $637,000 - $681,120
3
Beds
2
Baths
1,606
Sq Ft
$414/Sq Ft
Est. Value
About This Home
This home is located at 8771 Terra Pointe Way, West Jordan, UT 84088 and is currently estimated at $665,280, approximately $414 per square foot. 8771 Terra Pointe Way is a home located in Salt Lake County with nearby schools including Riverside Elementary School, West Jordan Middle School, and West Jordan High School.
Ownership History
Date
Name
Owned For
Owner Type
Purchase Details
Closed on
Jun 4, 2015
Sold by
Anderson Franklin D
Bought by
Anderson Franklin D and Anderson Kathie
Current Estimated Value
Home Financials for this Owner
Home Financials are based on the most recent Mortgage that was taken out on this home.
Original Mortgage
$532,500
Outstanding Balance
$410,513
Interest Rate
3.62%
Mortgage Type
Reverse Mortgage Home Equity Conversion Mortgage
Estimated Equity
$254,767
Purchase Details
Closed on
Jan 25, 2005
Sold by
Harvey Jenkins Construction Inc
Bought by
Anderson Franklin D
Home Financials for this Owner
Home Financials are based on the most recent Mortgage that was taken out on this home.
Original Mortgage
$246,305
Interest Rate
5.67%
Mortgage Type
Purchase Money Mortgage
Create a Home Valuation Report for This Property
The Home Valuation Report is an in-depth analysis detailing your home's value as well as a comparison with similar homes in the area
Home Values in the Area
Average Home Value in this Area
Purchase History
| Date | Buyer | Sale Price | Title Company |
|---|---|---|---|
| Anderson Franklin D | -- | United Title Services | |
| Anderson Franklin D | -- | Merrill Title |
Source: Public Records
Mortgage History
| Date | Status | Borrower | Loan Amount |
|---|---|---|---|
| Open | Anderson Franklin D | $532,500 | |
| Closed | Anderson Franklin D | $246,305 |
Source: Public Records
Tax History Compared to Growth
Tax History
| Year | Tax Paid | Tax Assessment Tax Assessment Total Assessment is a certain percentage of the fair market value that is determined by local assessors to be the total taxable value of land and additions on the property. | Land | Improvement |
|---|---|---|---|---|
| 2025 | $3,040 | $658,100 | $364,300 | $293,800 |
| 2024 | $3,040 | $584,800 | $354,700 | $230,100 |
| 2023 | $3,121 | $566,000 | $291,300 | $274,700 |
| 2022 | $3,223 | $575,000 | $285,600 | $289,400 |
| 2021 | $2,800 | $454,700 | $229,300 | $225,400 |
| 2020 | $2,689 | $409,800 | $218,400 | $191,400 |
| 2019 | $2,663 | $398,000 | $206,000 | $192,000 |
| 2018 | $2,518 | $373,200 | $206,000 | $167,200 |
| 2017 | $2,317 | $341,900 | $206,000 | $135,900 |
| 2016 | $2,376 | $329,400 | $160,700 | $168,700 |
| 2015 | $2,764 | $342,900 | $171,400 | $171,500 |
| 2014 | $2,658 | $353,800 | $163,700 | $190,100 |
Source: Public Records
Map
Nearby Homes
- 8713 Mountain Meadow Dr
- 8686 Covewood Place
- 8772 S Midvalley Dr
- 8843 Capernaum Rd
- 8976 S 1050 W
- 1254 W 8680 S
- 9121 S Hidden Peak Dr
- 9095 S 1150 W
- 1184 W Michaelsen Way
- 8686 S Temple Dr
- 1352 W 8780 S
- 1424 Stone Meadow Dr
- Building Three – Plan Four at Jordan Heights at View 78 - Midvale Jordan Heights
- Building Three – Plan Five at Jordan Heights at View 78 - Midvale Jordan Heights
- Building One – Plan Three at Jordan Heights at View 78 - Midvale Jordan Heights
- 8392 Sky Mirror Ln Unit 204
- Building One – Plan Two at Jordan Heights at View 78 - Midvale Jordan Heights
- Building One – Plan One at Jordan Heights at View 78 - Midvale Jordan Heights
- 8362 S Iris Lumi Ln Unit P303
- 8355 Sky Mirror Ln Unit M101
- 11353 S 1020 W Unit 503
- 11353 S 1020 W
- 8783 Terra Pointe Way
- 997 W 8760 S
- 8749 Terra Pointe Way
- 1028 W 8780 S
- 8791 S Terra Pointe Way
- 9051 S 1000 W
- 8762 Terra Pointe Way
- 8762 S Terra Pointe Way
- 992 W 8760 S
- 987 W 8760 S
- 1021 W 8780 S
- 8748 Terra Pointe Way
- 8737 Terra Pointe Way
- 8804 S Millrace View Cir Unit 8
- 8792 S Millrace View Cir
- 8792 S Millrace View Cir Unit 9
- 1031 W 8780 S
- 1038 W 8780 S