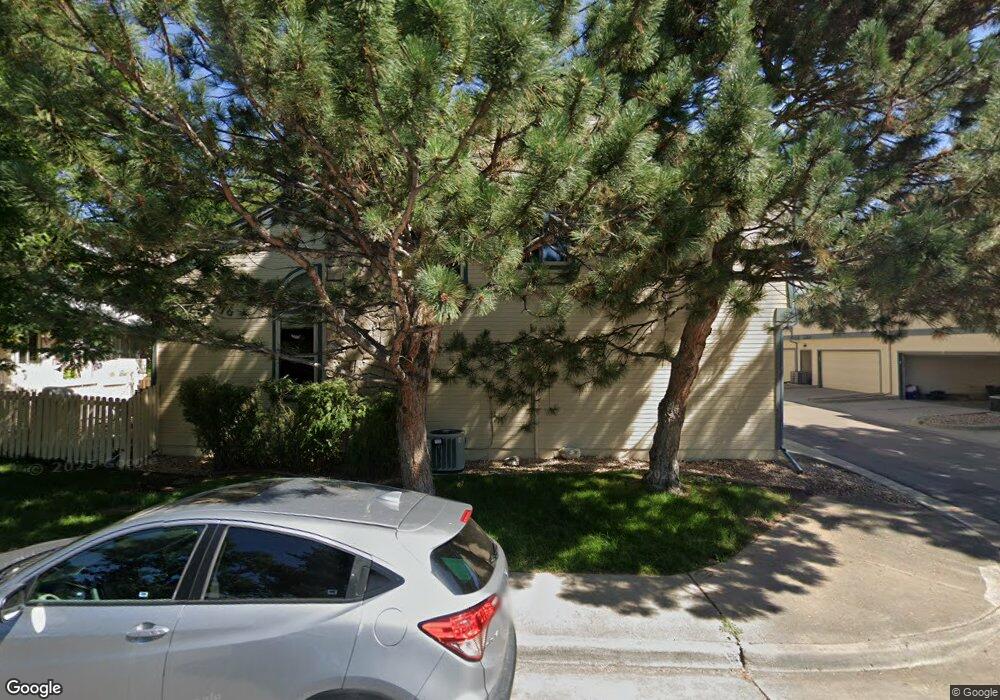
8778 Allison Dr Unit B Arvada, CO 80005
Trailside NeighborhoodEstimated Value: $373,000 - $414,000
2
Beds
3
Baths
1,169
Sq Ft
$340/Sq Ft
Est. Value
About This Home
This home is located at 8778 Allison Dr Unit B, Arvada, CO 80005 and is currently estimated at $397,568, approximately $340 per square foot. 8778 Allison Dr Unit B is a home located in Jefferson County with nearby schools including Weber Elementary School, Moore Middle School, and Pomona High School.
Ownership History
Date
Name
Owned For
Owner Type
Purchase Details
Closed on
May 14, 2012
Sold by
Hanchey Laura D
Bought by
Swier Lorance and Swier Anna Rose
Current Estimated Value
Home Financials for this Owner
Home Financials are based on the most recent Mortgage that was taken out on this home.
Original Mortgage
$229,350
Outstanding Balance
$159,797
Interest Rate
4.02%
Mortgage Type
Reverse Mortgage Home Equity Conversion Mortgage
Estimated Equity
$237,771
Purchase Details
Closed on
Jun 27, 1997
Sold by
Kuklenski Julie A
Bought by
Hanchey Laura D
Home Financials for this Owner
Home Financials are based on the most recent Mortgage that was taken out on this home.
Original Mortgage
$94,400
Interest Rate
7.92%
Purchase Details
Closed on
Mar 2, 1994
Sold by
Holtz Kimberly A and Meyers Stephanie L
Bought by
Kuklenski Julie A
Home Financials for this Owner
Home Financials are based on the most recent Mortgage that was taken out on this home.
Original Mortgage
$91,800
Interest Rate
7%
Mortgage Type
FHA
Create a Home Valuation Report for This Property
The Home Valuation Report is an in-depth analysis detailing your home's value as well as a comparison with similar homes in the area
Home Values in the Area
Average Home Value in this Area
Purchase History
| Date | Buyer | Sale Price | Title Company |
|---|---|---|---|
| Swier Lorance | $152,900 | Land Title Guarantee Company | |
| Hanchey Laura D | $118,000 | -- | |
| Kuklenski Julie A | $94,500 | -- |
Source: Public Records
Mortgage History
| Date | Status | Borrower | Loan Amount |
|---|---|---|---|
| Open | Swier Lorance | $229,350 | |
| Previous Owner | Hanchey Laura D | $94,400 | |
| Previous Owner | Kuklenski Julie A | $91,800 |
Source: Public Records
Tax History Compared to Growth
Tax History
| Year | Tax Paid | Tax Assessment Tax Assessment Total Assessment is a certain percentage of the fair market value that is determined by local assessors to be the total taxable value of land and additions on the property. | Land | Improvement |
|---|---|---|---|---|
| 2024 | $1,258 | $23,225 | $6,030 | $17,195 |
| 2023 | $1,258 | $23,225 | $6,030 | $17,195 |
| 2022 | $1,613 | $20,737 | $4,170 | $16,567 |
| 2021 | $1,636 | $21,333 | $4,290 | $17,043 |
| 2020 | $1,569 | $20,576 | $4,290 | $16,286 |
| 2019 | $1,544 | $20,576 | $4,290 | $16,286 |
| 2018 | $1,331 | $17,140 | $3,600 | $13,540 |
| 2017 | $1,191 | $17,140 | $3,600 | $13,540 |
| 2016 | $1,042 | $13,914 | $2,866 | $11,048 |
| 2015 | $933 | $13,914 | $2,866 | $11,048 |
| 2014 | $933 | $11,606 | $2,229 | $9,377 |
Source: Public Records
Map
Nearby Homes
- 8783 Allison Dr Unit D
- 8750 Allison Dr Unit D
- 14551 W 91st Ln Unit A
- 7740 W 87th Dr Unit C
- 8731 Yukon St
- 7932 W 90th Ave Unit 96
- 7940 W 90th Ave Unit 100
- 8741 Yukon St
- 7720 W 87th Dr Unit C
- 7780 W 87th Dr Unit E
- 7710 W 87th Dr Unit D
- 8971 Yukon St
- 8782 Carr Loop
- 7790 W 87th Dr Unit D
- 7870 W 87th Dr Unit J
- 8695 Yukon St Unit D
- 8696 W 86th Cir
- 8460 Zephyr St
- 8573 Dover Cir
- 8706 W 86th Dr
- 8778 Allison Dr Unit F
- 8778 Allison Dr Unit E
- 8778 Allison Dr Unit D
- 8778 Allison Dr Unit C
- 8778 Allison Dr Unit A
- 8774 Allison Dr Unit F
- 8774 Allison Dr Unit E
- 8774 Allison Dr Unit D
- 8774 Allison Dr Unit C
- 8774 Allison Dr Unit B
- 8774 Allison Dr Unit A
- 8782 Allison Dr Unit F
- 8782 Allison Dr Unit E
- 8782 Allison Dr Unit D
- 8782 Allison Dr Unit C
- 8782 Allison Dr Unit B
- 8782 Allison Dr Unit A
- 8770 Allison Dr Unit F
- 8770 Allison Dr Unit E
- 8770 Allison Dr Unit D