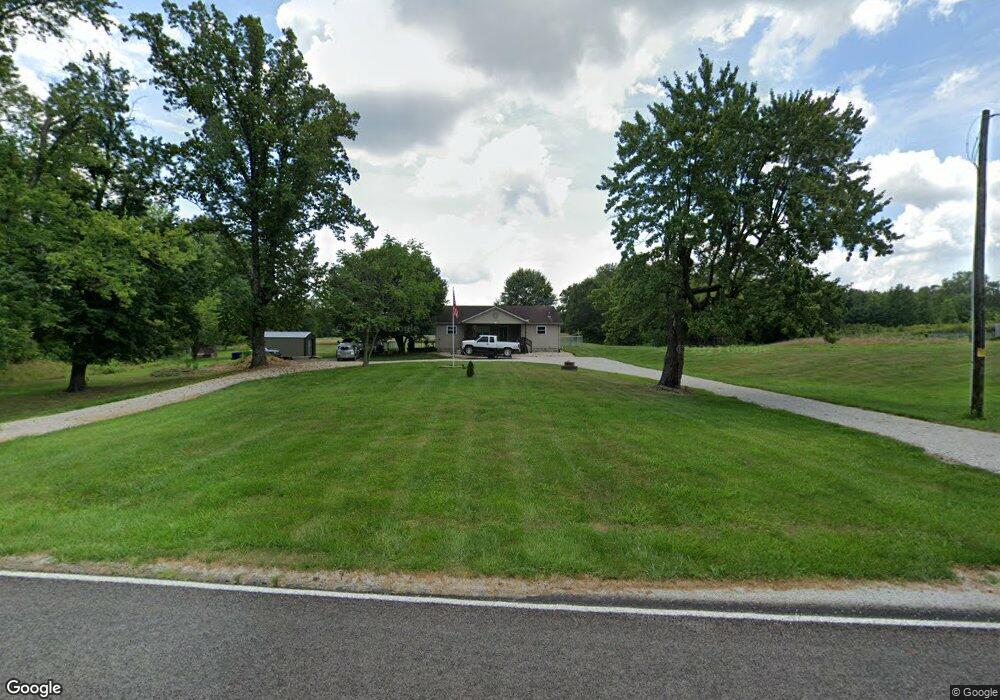
8778 E Pleasant Maple St Carlisle, IN 47838
Estimated Value: $134,000 - $177,000
3
Beds
1
Bath
1,504
Sq Ft
$108/Sq Ft
Est. Value
About This Home
This home is located at 8778 E Pleasant Maple St, Carlisle, IN 47838 and is currently estimated at $162,112, approximately $107 per square foot. 8778 E Pleasant Maple St is a home located in Sullivan County with nearby schools including Northeast East Elementary School, Northeast Middle School, and North Central High School.
Ownership History
Date
Name
Owned For
Owner Type
Purchase Details
Closed on
Feb 11, 2022
Sold by
James Akers
Bought by
Wilson Ryan
Current Estimated Value
Home Financials for this Owner
Home Financials are based on the most recent Mortgage that was taken out on this home.
Original Mortgage
$140,000
Outstanding Balance
$128,771
Interest Rate
3.56%
Mortgage Type
VA
Estimated Equity
$33,341
Purchase Details
Closed on
Jan 28, 2022
Sold by
Conover Patricia A
Bought by
Akers James
Home Financials for this Owner
Home Financials are based on the most recent Mortgage that was taken out on this home.
Original Mortgage
$140,000
Outstanding Balance
$128,771
Interest Rate
3.56%
Mortgage Type
VA
Estimated Equity
$33,341
Purchase Details
Closed on
Oct 6, 2017
Sold by
Todd Hale Johnny
Bought by
Day Jr Wayne E
Purchase Details
Closed on
Apr 30, 2008
Sold by
Hale Johnny Todd
Bought by
Hale Johnny Todd and Hale Tammy
Create a Home Valuation Report for This Property
The Home Valuation Report is an in-depth analysis detailing your home's value as well as a comparison with similar homes in the area
Purchase History
| Date | Buyer | Sale Price | Title Company |
|---|---|---|---|
| Wilson Ryan | $140,000 | None Listed On Document | |
| Akers James | -- | None Listed On Document | |
| Akers James | -- | None Listed On Document | |
| Day Jr Wayne E | $83,400 | -- | |
| Hale Johnny Todd | -- | -- |
Source: Public Records
Mortgage History
| Date | Status | Borrower | Loan Amount |
|---|---|---|---|
| Open | Wilson Ryan | $140,000 |
Source: Public Records
Tax History
| Year | Tax Paid | Tax Assessment Tax Assessment Total Assessment is a certain percentage of the fair market value that is determined by local assessors to be the total taxable value of land and additions on the property. | Land | Improvement |
|---|---|---|---|---|
| 2025 | -- | $119,100 | $15,100 | $104,000 |
| 2024 | -- | $89,800 | $15,100 | $74,700 |
| 2023 | -- | $90,600 | $15,100 | $75,500 |
| 2022 | $0 | $93,300 | $15,100 | $78,200 |
| 2021 | $411 | $79,200 | $15,100 | $64,100 |
| 2020 | $472 | $80,800 | $15,100 | $65,700 |
| 2019 | $475 | $84,000 | $15,100 | $68,900 |
| 2018 | $463 | $84,900 | $15,100 | $69,800 |
| 2017 | $502 | $84,900 | $15,100 | $69,800 |
| 2016 | $446 | $82,500 | $15,100 | $67,400 |
| 2014 | $457 | $83,000 | $15,100 | $67,900 |
| 2013 | $455 | $83,000 | $15,100 | $67,900 |
Source: Public Records
Map
Nearby Homes
- 0 E Pleasant Ohaver St
- 2495 S 1450 W
- 0000 W 100 S
- 4499 Indiana 59
- 6783 S State Road 59
- 1796 Indiana 59
- 15312 W 50 N Rd
- 14978 W 50 N Rd
- 0 E Grandview Rd
- 5072 S 1100 W
- 13681 W Auburn Ridge Ct
- 550 S State Road 59
- 10623 W 300 S
- 103 E College St
- 1487 SE 1st St
- 1380 N 1375 W
- 0 SE 1st St
- 189 E St SW
- 230 E St SW
- 000 8th St NW
- 8778 E Pleasant Maple St
- 8764 E Pleasant Maple St
- 8822 E Pleasant Maple St
- 8801 E Pleasant St
- 8711 E Pleasant Maple St
- 8734 E Pleasant Maple St
- 8711 E Maple St
- 8714 E Pleasant Maple St
- 8723 E Pleasant Maple St
- 8710 E Pleasant Maple St
- 8972 E Pleasant Maple St
- 8972 E Pleasant Maple St
- 7837 Pleasant Church St
- 7661 S Pleasant Wilson St
- 8723 E Maple St
- 7669 S Pleasant Church St
- 7664 S Pleasant Church St
- 7709 S Pleasant Main St
- 8819 E Pleasant Ohaver St
- 7906 S Pleasant Church St
Your Personal Tour Guide
Ask me questions while you tour the home.