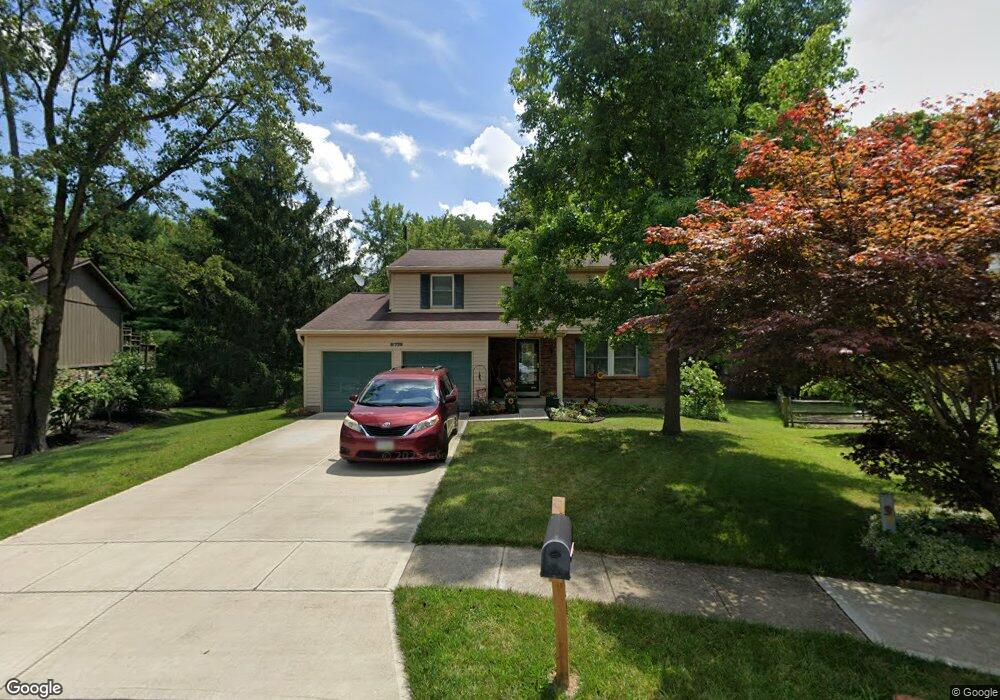
8778 Logger Place Mason, OH 45040
Landen NeighborhoodEstimated Value: $344,000 - $408,000
4
Beds
3
Baths
1,815
Sq Ft
$206/Sq Ft
Est. Value
About This Home
This home is located at 8778 Logger Place, Mason, OH 45040 and is currently estimated at $374,419, approximately $206 per square foot. 8778 Logger Place is a home located in Warren County with nearby schools including Kings Junior High School, Kings High School, and Montessori Academy of Cincinnati.
Ownership History
Date
Name
Owned For
Owner Type
Purchase Details
Closed on
Jun 4, 1992
Sold by
Brady Brady and Brady Daniel K
Bought by
Wilson Wilson and Wilson Daryl E
Current Estimated Value
Purchase Details
Closed on
Aug 22, 1988
Sold by
Paddock Cloyde A and Paddock Ann
Bought by
Brady and Brady Daniel K
Purchase Details
Closed on
Nov 29, 1984
Sold by
Procter and Gamble Distribu
Bought by
Paddock and Paddock Cloyde A
Purchase Details
Closed on
Aug 28, 1984
Sold by
Wilson Joel W and Wilson Wendy M
Bought by
Procter and Gamble Distribu
Purchase Details
Closed on
Sep 13, 1983
Sold by
Mcclure Mcclure and Mcclure Wayne E
Bought by
Wilson Wilson and Wilson Joel W
Purchase Details
Closed on
Jun 22, 1981
Sold by
Ryland Group & Inc
Purchase Details
Closed on
Apr 21, 1981
Sold by
Landen Farm Co
Purchase Details
Closed on
Jun 25, 1980
Sold by
Landen Farm Co
Create a Home Valuation Report for This Property
The Home Valuation Report is an in-depth analysis detailing your home's value as well as a comparison with similar homes in the area
Home Values in the Area
Average Home Value in this Area
Purchase History
| Date | Buyer | Sale Price | Title Company |
|---|---|---|---|
| Wilson Wilson | $110,500 | -- | |
| Brady | $95,000 | -- | |
| Paddock | $76,000 | -- | |
| Procter | -- | -- | |
| Wilson Wilson | $73,000 | -- | |
| -- | $75,100 | -- | |
| -- | $13,900 | -- | |
| -- | -- | -- |
Source: Public Records
Tax History Compared to Growth
Tax History
| Year | Tax Paid | Tax Assessment Tax Assessment Total Assessment is a certain percentage of the fair market value that is determined by local assessors to be the total taxable value of land and additions on the property. | Land | Improvement |
|---|---|---|---|---|
| 2024 | $4,846 | $92,840 | $24,500 | $68,340 |
| 2023 | $4,270 | $73,468 | $12,915 | $60,553 |
| 2022 | $4,191 | $73,469 | $12,915 | $60,554 |
| 2021 | $3,511 | $73,469 | $12,915 | $60,554 |
| 2020 | $3,394 | $59,731 | $10,500 | $49,231 |
| 2019 | $3,435 | $59,731 | $10,500 | $49,231 |
| 2018 | $3,414 | $59,731 | $10,500 | $49,231 |
| 2017 | $3,577 | $55,374 | $10,371 | $45,003 |
| 2016 | $3,668 | $55,374 | $10,371 | $45,003 |
| 2015 | $3,117 | $55,374 | $10,371 | $45,003 |
| 2014 | $3,117 | $49,000 | $9,180 | $39,830 |
| 2013 | $3,121 | $56,070 | $10,500 | $45,570 |
Source: Public Records
Map
Nearby Homes
- 3833 Spring Mill Way
- 8650 Rocky Trail
- 8562 High Trail Ct
- 4198 Oak Tree Ct
- 3536 Stoneboat Ct
- 8214 Winding Trail Place
- 8326 Winding Trail Place
- 8732 Columbia Rd
- 4015 Oak Tree Ct
- 4230 Crestview Dr
- 8074 Big Oak Cir
- 3444 Cutter Ln
- 4027 Meadow Grove Ln
- 9723 Carriage Run Ct
- 9623 Greenery Ct Unit 313B
- 9530 Greenery Ct Unit 305C
- 8305 Woodbridge Ln
- 7754 Cove View Dr
- 3476 Twenty Mile Way Unit 3476
- 3204 Dogwood Ct N
- 8774 Logger Place
- 8790 Logger Place
- 8845 Meadow Dr
- 8808 Logger Place
- 8770 Logger Place
- 8839 Meadow Dr
- 8855 Meadow Dr
- 8777 Logger Place
- 8828 Logger Place
- 8785 Logger Place
- 8865 Meadow Dr
- 8829 Meadow Dr
- 8791 Logger Place
- 8844 Logger Place
- 8801 Logger Place
- 4015 Irwin Simpson Rd
- 8809 Logger Place
- 8819 Meadow Dr
- 8883 Meadow Dr
- 8846 Meadow Dr