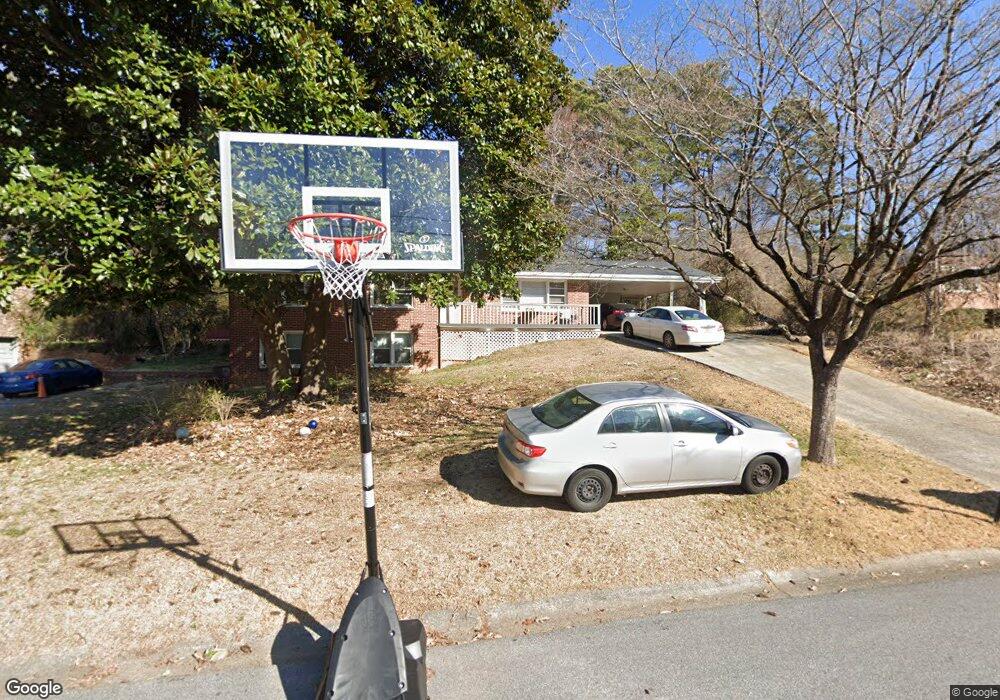
878 Lakeside Dr SW Mableton, GA 30126
Estimated Value: $188,000 - $256,000
3
Beds
2
Baths
1,284
Sq Ft
$183/Sq Ft
Est. Value
About This Home
This home is located at 878 Lakeside Dr SW, Mableton, GA 30126 and is currently estimated at $234,778, approximately $182 per square foot. 878 Lakeside Dr SW is a home located in Cobb County with nearby schools including Clay-Harmony Leland Elementary School, Lindley Middle School, and Pebblebrook High School.
Ownership History
Date
Name
Owned For
Owner Type
Purchase Details
Closed on
Oct 4, 2023
Sold by
Rodriguez Michael
Bought by
Rodriguez Claudia C
Current Estimated Value
Purchase Details
Closed on
Nov 20, 2008
Sold by
Citimortgage Inc
Bought by
Rodriguez Michael
Purchase Details
Closed on
May 6, 2008
Sold by
Dixon Henry L
Bought by
Citimortgage Inc
Purchase Details
Closed on
Mar 31, 2005
Sold by
Cullens Johnnie L
Bought by
Dixon Henry L
Home Financials for this Owner
Home Financials are based on the most recent Mortgage that was taken out on this home.
Original Mortgage
$87,100
Interest Rate
7.75%
Mortgage Type
New Conventional
Purchase Details
Closed on
Jan 14, 1994
Sold by
Y K K Ap America Inc
Bought by
Cullens Johnnie L
Home Financials for this Owner
Home Financials are based on the most recent Mortgage that was taken out on this home.
Original Mortgage
$64,250
Interest Rate
7.13%
Mortgage Type
FHA
Create a Home Valuation Report for This Property
The Home Valuation Report is an in-depth analysis detailing your home's value as well as a comparison with similar homes in the area
Home Values in the Area
Average Home Value in this Area
Purchase History
| Date | Buyer | Sale Price | Title Company |
|---|---|---|---|
| Rodriguez Claudia C | -- | None Listed On Document | |
| Rodriguez Michael | $64,000 | -- | |
| Citimortgage Inc | -- | -- | |
| Dixon Henry L | $108,900 | -- | |
| Cullens Johnnie L | $64,900 | -- |
Source: Public Records
Mortgage History
| Date | Status | Borrower | Loan Amount |
|---|---|---|---|
| Previous Owner | Dixon Henry L | $87,100 | |
| Previous Owner | Cullens Johnnie L | $64,250 |
Source: Public Records
Tax History Compared to Growth
Tax History
| Year | Tax Paid | Tax Assessment Tax Assessment Total Assessment is a certain percentage of the fair market value that is determined by local assessors to be the total taxable value of land and additions on the property. | Land | Improvement |
|---|---|---|---|---|
| 2025 | $2,315 | $76,832 | $14,000 | $62,832 |
| 2024 | $2,316 | $76,832 | $14,000 | $62,832 |
| 2023 | $2,316 | $76,832 | $14,000 | $62,832 |
| 2022 | $1,181 | $38,900 | $8,000 | $30,900 |
| 2021 | $1,181 | $38,900 | $8,000 | $30,900 |
| 2020 | $1,181 | $38,900 | $8,000 | $30,900 |
| 2019 | $1,181 | $38,900 | $8,000 | $30,900 |
| 2018 | $1,112 | $36,644 | $4,800 | $31,844 |
| 2017 | $555 | $19,316 | $4,800 | $14,516 |
| 2016 | $555 | $19,316 | $4,800 | $14,516 |
| 2015 | $376 | $12,748 | $3,200 | $9,548 |
| 2014 | $379 | $12,748 | $0 | $0 |
Source: Public Records
Map
Nearby Homes
- 5981 Pisgah Rd SW
- 6266 Britt Rd SW
- Harbor Plan at Mableton Station
- Robie Plan at Mableton Station
- Aisle Plan at Mableton Station
- Elston Plan at Mableton Station
- 1034 Bettina Ct SW
- 1031 Bettina Ct SW
- 5777 Whispering Pines Rd SW
- 6281 Denny Ln SW
- 6251 Honeybell Alley
- 846 Orris Ln SW
- 1144 Angelia Dr SW
- 6302 Mount Pisgah Ln
- 767 Kenneth Ln SW
- 6243 Honeybell Alley
- KNOLLWOOD Plan at Mableton Station - Townhomes
- 5800 Cedar Ln SW
- 1076 Stoney Creek Ln
- 1065 Stoney Creek Ln Unit 2
- 894 Lakeside Dr SW
- 885 Lakeside Dr SW
- 877 Sunset Blvd SW
- 891 Sunset Blvd SW
- 844 Lakeside Dr SW
- 876 Lakeside Dr SW
- 865 Lakeside Dr SW
- 859 Sunset Blvd SW
- 884 Sunset Blvd SW
- 864 Sunset Blvd SW
- 851 Lakeside Dr SW
- 854 Sunset Blvd SW
- 825 Lakeside Dr SW
- 6060 Freeman Place SW
- 859 Old Alabama Rd SW
- 838 Sunset Blvd SW
- 836 Sunset Blvd SW
- 910 Old Alabama Rd SW
- 843 Old Alabama Rd SW Unit 843A
- 822 Sunset Blvd SW