Estimated Value: $582,000 - $745,793
Studio
--
Bath
1,750
Sq Ft
$364/Sq Ft
Est. Value
About This Home
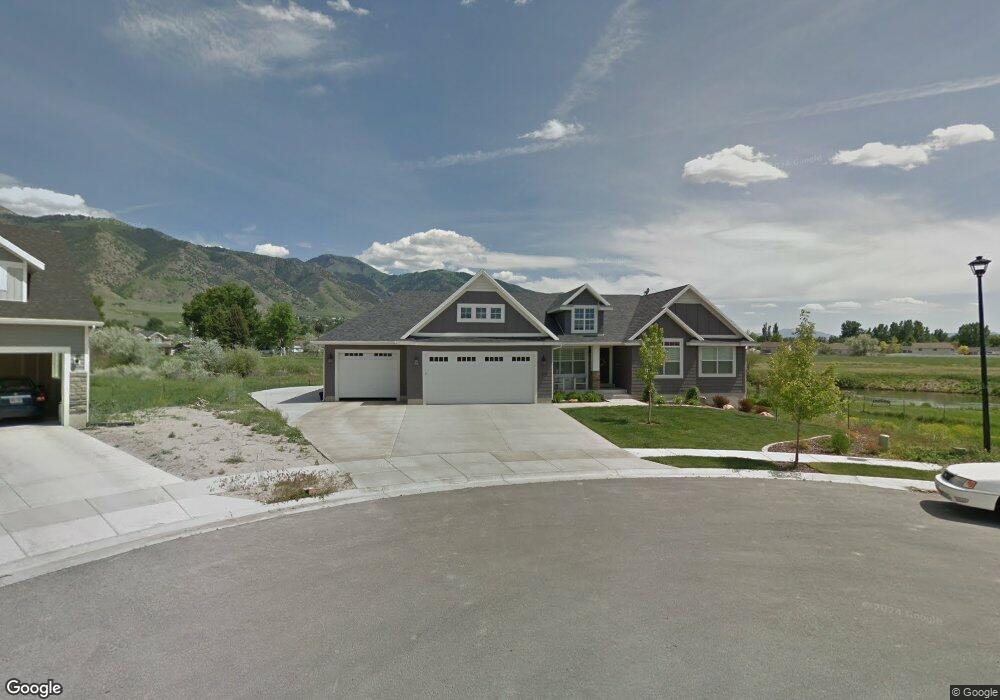
This home is located at 878 S 525 E, Logan, UT 84321 and is currently estimated at $636,448, approximately $363 per square foot. 878 S 525 E is a home with nearby schools including River Heights School, Spring Creek Middle School, and South Cache Middle School.
Ownership History
Date
Name
Owned For
Owner Type
Purchase Details
Closed on
Jun 20, 2011
Sold by
Webb David
Bought by
Webb David L and Webb Lacy K
Current Estimated Value
Home Financials for this Owner
Home Financials are based on the most recent Mortgage that was taken out on this home.
Original Mortgage
$284,800
Outstanding Balance
$195,628
Interest Rate
4.63%
Mortgage Type
New Conventional
Estimated Equity
$440,820
Purchase Details
Closed on
Apr 2, 2010
Sold by
Foxridge Development Corporation
Bought by
Webb David
Home Financials for this Owner
Home Financials are based on the most recent Mortgage that was taken out on this home.
Original Mortgage
$60,093
Interest Rate
4.88%
Mortgage Type
Purchase Money Mortgage
Create a Home Valuation Report for This Property
The Home Valuation Report is an in-depth analysis detailing your home's value as well as a comparison with similar homes in the area
Purchase History
| Date | Buyer | Sale Price | Title Company |
|---|---|---|---|
| Webb David L | -- | Cache Title Company | |
| Webb David | -- | Cache Title Company |
Source: Public Records
Mortgage History
| Date | Status | Borrower | Loan Amount |
|---|---|---|---|
| Open | Webb David L | $284,800 | |
| Closed | Webb David | $60,093 |
Source: Public Records
Tax History
| Year | Tax Paid | Tax Assessment Tax Assessment Total Assessment is a certain percentage of the fair market value that is determined by local assessors to be the total taxable value of land and additions on the property. | Land | Improvement |
|---|---|---|---|---|
| 2025 | $2,836 | $433,170 | $0 | $0 |
| 2024 | $2,998 | $424,715 | $0 | $0 |
| 2023 | $3,166 | $420,615 | $0 | $0 |
| 2022 | $2,964 | $374,495 | $0 | $0 |
| 2021 | $2,438 | $472,846 | $72,400 | $400,446 |
| 2020 | $2,311 | $420,614 | $72,400 | $348,214 |
| 2019 | $2,438 | $420,613 | $72,400 | $348,213 |
| 2018 | $2,304 | $383,305 | $72,400 | $310,905 |
| 2017 | $2,335 | $202,675 | $0 | $0 |
| 2016 | $2,375 | $184,195 | $0 | $0 |
| 2015 | $2,161 | $184,195 | $0 | $0 |
| 2014 | $1,748 | $153,025 | $0 | $0 |
| 2013 | -- | $153,025 | $0 | $0 |
Source: Public Records
Map
Nearby Homes
- 821 S 525 E
- 694 S 600 E
- 405 N Willow Ln W
- 410 Cobblestone
- 329 N Springs Ln
- 310 Spring Creek Pkwy
- 239 Hidden Creek Dr
- 374 N 100 W
- 472 Cobblestone
- 55 Mountain View Cir
- 175 N 100 W
- 76 E Springs Ln
- 5 E 200 N
- 198 W 150 N
- 560 750 E Unit 39
- 503 750 E Unit 31
- 540 750 E Unit 41
- 550 750 E Unit 40
- 429 750 E Unit 25
- 151 E 360 N
Your Personal Tour Guide
Ask me questions while you tour the home.