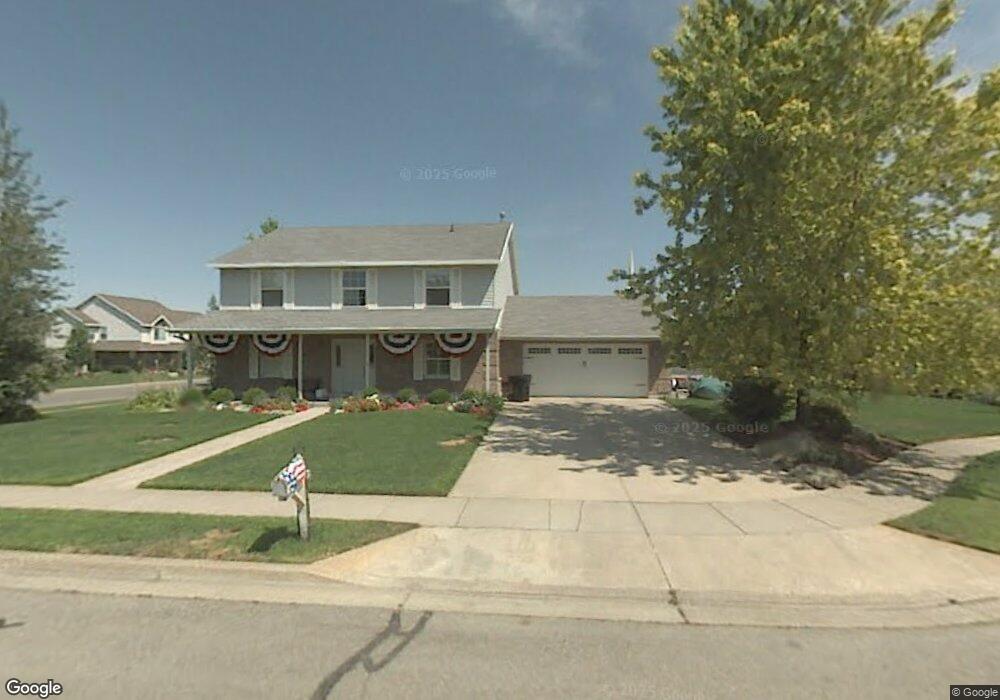
878 W 1700 N West Bountiful, UT 84087
Estimated Value: $583,000 - $809,000
4
Beds
3
Baths
3,496
Sq Ft
$209/Sq Ft
Est. Value
About This Home
This home is located at 878 W 1700 N, West Bountiful, UT 84087 and is currently estimated at $731,539, approximately $209 per square foot. 878 W 1700 N is a home located in Davis County with nearby schools including West Bountiful Elementary School, Bountiful Junior High School, and Viewmont High School.
Ownership History
Date
Name
Owned For
Owner Type
Purchase Details
Closed on
Sep 15, 2017
Sold by
King Lonny H and King Amy Z
Bought by
King Lonny H and King Living Trust
Current Estimated Value
Purchase Details
Closed on
Sep 15, 2009
Sold by
King Lonny H
Bought by
King Lonny H and King Amy Z
Home Financials for this Owner
Home Financials are based on the most recent Mortgage that was taken out on this home.
Original Mortgage
$100,000
Interest Rate
5.18%
Mortgage Type
Credit Line Revolving
Purchase Details
Closed on
Dec 26, 1997
Sold by
King Lonny H and King Amy Z
Bought by
King Lonny H
Home Financials for this Owner
Home Financials are based on the most recent Mortgage that was taken out on this home.
Original Mortgage
$100,300
Interest Rate
7.16%
Purchase Details
Closed on
Jan 27, 1994
Sold by
Mountain Fuel Supply Company
Bought by
Smoot Stanley M
Create a Home Valuation Report for This Property
The Home Valuation Report is an in-depth analysis detailing your home's value as well as a comparison with similar homes in the area
Home Values in the Area
Average Home Value in this Area
Purchase History
| Date | Buyer | Sale Price | Title Company |
|---|---|---|---|
| King Lonny H | -- | -- | |
| King Lonny H | -- | Salt Lake Title & Escrow Com | |
| King Lonny H | -- | Backman Stewart Title Servic | |
| Smoot Stanley M | -- | Backman Stewart Title Servic |
Source: Public Records
Mortgage History
| Date | Status | Borrower | Loan Amount |
|---|---|---|---|
| Previous Owner | King Lonny H | $100,000 | |
| Previous Owner | King Lonny H | $100,300 |
Source: Public Records
Tax History Compared to Growth
Tax History
| Year | Tax Paid | Tax Assessment Tax Assessment Total Assessment is a certain percentage of the fair market value that is determined by local assessors to be the total taxable value of land and additions on the property. | Land | Improvement |
|---|---|---|---|---|
| 2025 | $4,368 | $384,450 | $136,607 | $247,843 |
| 2024 | $4,107 | $369,050 | $112,439 | $256,611 |
| 2023 | $3,966 | $652,000 | $211,972 | $440,028 |
| 2022 | $4,093 | $376,750 | $102,256 | $274,494 |
| 2021 | $3,660 | $516,000 | $139,031 | $376,969 |
| 2020 | $2,713 | $373,000 | $128,147 | $244,853 |
| 2019 | $2,723 | $371,000 | $128,623 | $242,377 |
| 2018 | $2,596 | $348,000 | $127,773 | $220,227 |
| 2016 | $2,343 | $170,445 | $34,474 | $135,971 |
| 2015 | $2,288 | $157,630 | $34,474 | $123,156 |
| 2014 | $2,040 | $143,396 | $34,474 | $108,922 |
| 2013 | -- | $140,366 | $42,972 | $97,394 |
Source: Public Records
Map
Nearby Homes
- 988 W 1950 N Unit 134
- 1084 W Audrey Ln Unit 20
- 1084 W Audrey Ln
- 825 W 1320 N
- 637 W 1600 N
- 2257 N 830 W
- 668 W 2300 N
- Lincoln Farmhouse Plan at Belmont Farms
- Belmont Traditional Plan at Belmont Farms
- Hampton Traditional Plan at Belmont Farms
- 548 S 675 W
- 366 W 1000 N
- 239 Lyman Ln
- 234 Leah Cir
- 324 S 600 W
- 204 Lyman Ln
- 790 N 500 W
- 235 W 1400 N
- 420 Rawlins Cir
- 1552 N 200 W