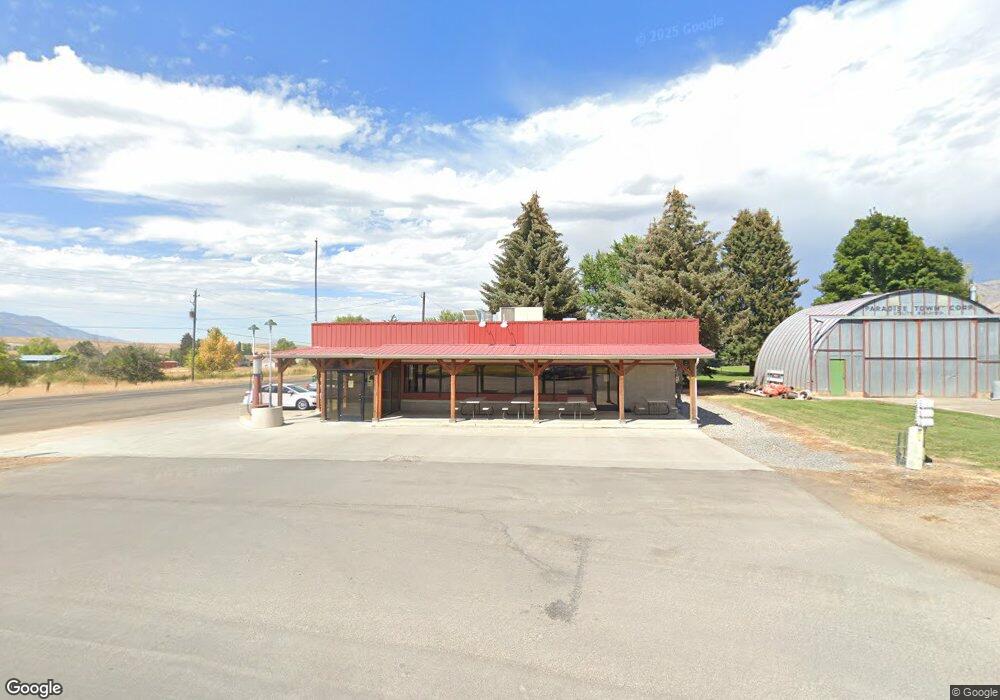
8782 S 410 E Paradise, UT 84328
Estimated Value: $1,146,000 - $1,786,000
Studio
--
Bath
4,753
Sq Ft
$288/Sq Ft
Est. Value
About This Home
This home is located at 8782 S 410 E, Paradise, UT 84328 and is currently estimated at $1,368,050, approximately $287 per square foot. 8782 S 410 E is a home with nearby schools including Canyon School, South Cache Middle School, and Spring Creek Middle School.
Ownership History
Date
Name
Owned For
Owner Type
Purchase Details
Closed on
May 24, 2024
Sold by
Jones Dennis A
Bought by
Dennis Alan Jones Family Trust and Jones
Current Estimated Value
Purchase Details
Closed on
Jun 1, 2022
Sold by
Dennis Alan Jones Family Trust
Bought by
Jones Dennis A
Purchase Details
Closed on
Feb 11, 2016
Sold by
Jones Dennis A
Bought by
Jones Dennis Alan
Home Financials for this Owner
Home Financials are based on the most recent Mortgage that was taken out on this home.
Original Mortgage
$417,000
Interest Rate
3.97%
Mortgage Type
New Conventional
Purchase Details
Closed on
Sep 4, 2012
Sold by
Jones Dennis and Jones Jane
Bought by
Jones Dennis Alan
Purchase Details
Closed on
Oct 17, 2001
Sold by
Buirley Steve
Bought by
Jones Dennis and Jones Jane
Create a Home Valuation Report for This Property
The Home Valuation Report is an in-depth analysis detailing your home's value as well as a comparison with similar homes in the area
Purchase History
| Date | Buyer | Sale Price | Title Company |
|---|---|---|---|
| Dennis Alan Jones Family Trust | -- | None Listed On Document | |
| Jones Dennis A | -- | New Title Company Name | |
| Jones Dennis Alan | -- | Northern Title Company | |
| Jones Dennis A | -- | Northern Title Company | |
| Jones Dennis Alan | -- | None Available | |
| Jones Dennis | -- | American Secure Title |
Source: Public Records
Mortgage History
| Date | Status | Borrower | Loan Amount |
|---|---|---|---|
| Previous Owner | Jones Dennis A | $417,000 |
Source: Public Records
Tax History
| Year | Tax Paid | Tax Assessment Tax Assessment Total Assessment is a certain percentage of the fair market value that is determined by local assessors to be the total taxable value of land and additions on the property. | Land | Improvement |
|---|---|---|---|---|
| 2025 | $4,903 | $795,220 | $0 | $0 |
| 2024 | $4,052 | $608,540 | $0 | $0 |
| 2023 | $4,321 | $606,375 | $0 | $0 |
| 2022 | $4,519 | $606,380 | $0 | $0 |
| 2021 | $4,454 | $882,315 | $157,710 | $724,605 |
| 2020 | $4,089 | $759,118 | $157,710 | $601,408 |
| 2019 | $4,101 | $714,588 | $113,180 | $601,408 |
| 2018 | $3,723 | $625,890 | $113,180 | $512,710 |
| 2017 | $3,618 | $341,635 | $0 | $0 |
| 2016 | $3,662 | $292,345 | $0 | $0 |
| 2015 | $2,761 | $258,140 | $0 | $0 |
| 2014 | $2,658 | $256,030 | $0 | $0 |
| 2013 | -- | $256,155 | $0 | $0 |
Source: Public Records
Map
Nearby Homes
- 65 E 8800 S
- 7419 S 400 W
- 8797 S Bridger Blvd
- 248 E 9300 S
- 140 W 9100 S
- 8975 S 200 W
- 0 8800 S
- 9800 S Hwy 165
- 634 W 8300 S
- 200 E 7000 S
- 366 E 6600 S
- 760 E 1250 S
- 730 E 1250 S
- 674 E 1250 S
- 768 E 1100 S
- 676 E 1100 S
- 4000 Ant Flat Rd #53 Unit 53
- 0 Lot 60 Legacy Ranch at Monte C Unit 2106768
- 377 E 8900 S
- 69 N 850 W Unit 89
- 410 E 8780 S
- 417 E 8780 S
- 435 E 8900 S Unit 2
- 250 E 8800 S
- 517 E 8780 S Unit 3
- 517 E 8780 S
- 489 E 8900 S Unit 3
- 293 E 8800 S
- 293 E 8800 S Unit 10
- 274 E 8800 S
- 255 E 8800 S
- 541 E 8900 S Unit 4
- 541 E 8900 S
- 1525 E 8900 S
- 445 E 8900 S
- 351 E 8900 S Unit 1
- 401 E 8900 S
- 238 E 8800 S
- 290 E 8650 S
- 8860 S 200 E
Your Personal Tour Guide
Ask me questions while you tour the home.