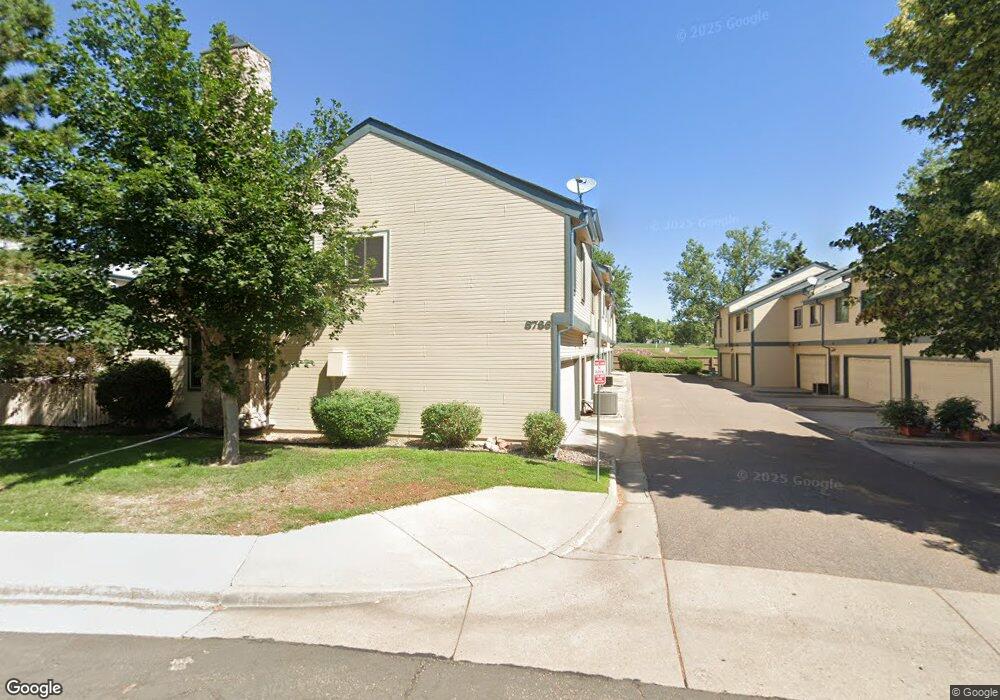
8786 Allison Dr Unit C Arvada, CO 80005
Trailside NeighborhoodEstimated Value: $384,000 - $448,000
3
Beds
3
Baths
1,355
Sq Ft
$304/Sq Ft
Est. Value
About This Home
This home is located at 8786 Allison Dr Unit C, Arvada, CO 80005 and is currently estimated at $412,242, approximately $304 per square foot. 8786 Allison Dr Unit C is a home located in Jefferson County with nearby schools including Weber Elementary School, Moore Middle School, and Pomona High School.
Ownership History
Date
Name
Owned For
Owner Type
Purchase Details
Closed on
Mar 5, 2014
Sold by
Laurel Patten S
Bought by
Laurel Patten S and Laurel Nove T
Current Estimated Value
Purchase Details
Closed on
Nov 19, 2013
Sold by
Moreno Eduardo M
Bought by
Laurel Patten S
Home Financials for this Owner
Home Financials are based on the most recent Mortgage that was taken out on this home.
Original Mortgage
$146,800
Outstanding Balance
$109,736
Interest Rate
4.29%
Mortgage Type
New Conventional
Estimated Equity
$302,506
Purchase Details
Closed on
Oct 18, 1993
Sold by
Walters Patrick M and Walters Kristy Lynn
Bought by
Aarts Ringold C and Aarts Patricia E
Home Financials for this Owner
Home Financials are based on the most recent Mortgage that was taken out on this home.
Original Mortgage
$92,225
Interest Rate
6.96%
Mortgage Type
FHA
Create a Home Valuation Report for This Property
The Home Valuation Report is an in-depth analysis detailing your home's value as well as a comparison with similar homes in the area
Home Values in the Area
Average Home Value in this Area
Purchase History
| Date | Buyer | Sale Price | Title Company |
|---|---|---|---|
| Laurel Patten S | -- | None Available | |
| Laurel Patten S | $183,500 | Chicago Title Co | |
| Aarts Ringold C | $95,000 | Security Title Guarantee Co |
Source: Public Records
Mortgage History
| Date | Status | Borrower | Loan Amount |
|---|---|---|---|
| Open | Laurel Patten S | $146,800 | |
| Previous Owner | Aarts Ringold C | $92,225 |
Source: Public Records
Tax History Compared to Growth
Tax History
| Year | Tax Paid | Tax Assessment Tax Assessment Total Assessment is a certain percentage of the fair market value that is determined by local assessors to be the total taxable value of land and additions on the property. | Land | Improvement |
|---|---|---|---|---|
| 2024 | $1,854 | $24,341 | $6,030 | $18,311 |
| 2023 | $1,854 | $24,341 | $6,030 | $18,311 |
| 2022 | $1,662 | $21,367 | $4,170 | $17,197 |
| 2021 | $1,686 | $21,982 | $4,290 | $17,692 |
| 2020 | $1,609 | $21,102 | $4,290 | $16,812 |
| 2019 | $1,584 | $21,102 | $4,290 | $16,812 |
| 2018 | $1,389 | $17,898 | $3,600 | $14,298 |
| 2017 | $1,244 | $17,898 | $3,600 | $14,298 |
| 2016 | $1,101 | $14,695 | $2,866 | $11,829 |
| 2015 | $999 | $14,695 | $2,866 | $11,829 |
| 2014 | $999 | $12,426 | $2,229 | $10,197 |
Source: Public Records
Map
Nearby Homes
- 8783 Allison Dr Unit D
- 8750 Allison Dr Unit D
- 8782 Carr Loop
- 7940 W 90th Ave Unit 100
- 7932 W 90th Ave Unit 96
- 7740 W 87th Dr Unit C
- 14551 W 91st Ln Unit A
- 8696 W 86th Cir
- 8731 Yukon St
- 8741 Yukon St
- 7720 W 87th Dr Unit C
- 7780 W 87th Dr Unit E
- 7710 W 87th Dr Unit D
- 8971 Yukon St
- 7870 W 87th Dr Unit J
- 7790 W 87th Dr Unit D
- 8695 Yukon St Unit D
- 8460 Zephyr St
- 8706 W 86th Dr
- 8573 Dover Cir
- 8786 Allison Dr Unit F
- 8786 Allison Dr Unit E
- 8786 Allison Dr Unit D
- 8786 Allison Dr Unit B
- 8786 Allison Dr Unit A
- 8782 Allison Dr Unit F
- 8782 Allison Dr Unit E
- 8782 Allison Dr Unit D
- 8782 Allison Dr Unit C
- 8782 Allison Dr Unit B
- 8782 Allison Dr Unit A
- 8790 Allison Dr Unit F
- 8790 Allison Dr Unit E
- 8790 Allison Dr Unit C
- 8790 Allison Dr Unit B
- 8790 Allison Dr Unit A
- 8778 Allison Dr Unit F
- 8778 Allison Dr Unit E
- 8778 Allison Dr Unit D
- 8778 Allison Dr Unit C