NOT LISTED FOR SALE

8787 Sylvia Beach Ct Unit na Las Vegas, NV 89148

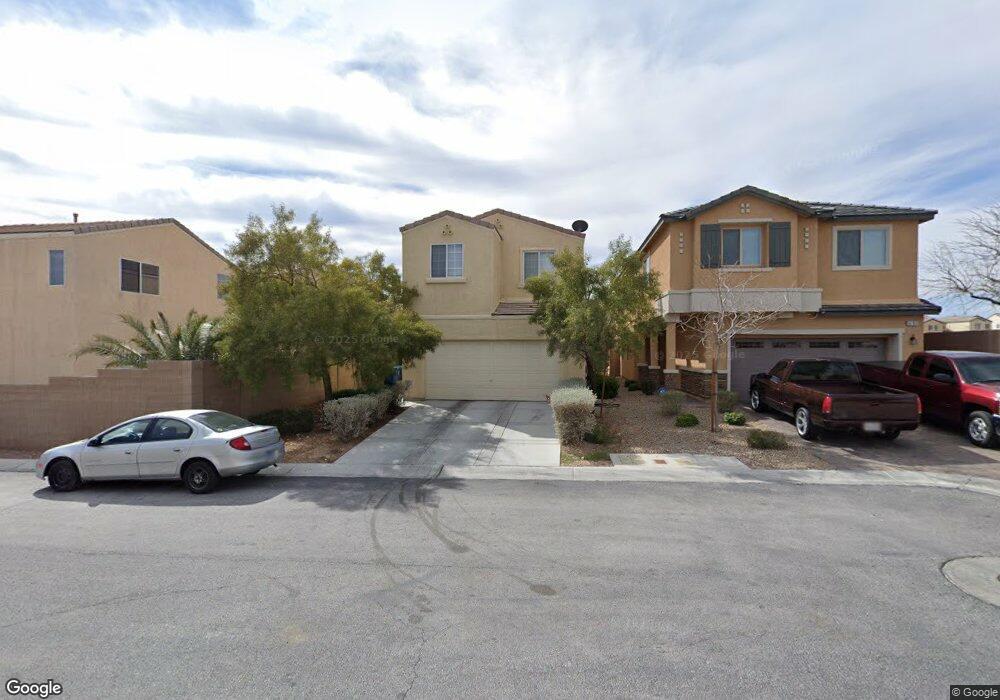
Estimated Value: $467,208 - $606,000

3 Beds
3 Baths
2,104 Sq Ft
$244/Sq Ft Est. Value

About This Home

Fantastic SW home features, formal living room, formal dining, room, family room w fireplace, gourmet kitchen w plenty of counter space, pantry, custom tile floors, huge master suite walk in closet and attached spa like bath, cozy rear yard w EZ landscape. THIS IS IT!

Ownership History

Date Name Owned For Owner Type

Purchase Details

Closed on
May 30, 2014
Sold by
2014 & 1 Ih Equity Owner Lp
Bought by
2014 & 1 Ih Borrower Lp
Current Estimated Value
$512,552

Home Financials for this Owner

Home Financials are based on the most recent Mortgage that was taken out on this home.
Original Mortgage
$993,738,000
Outstanding Balance
$757,278,384
Interest Rate
4.25%
Mortgage Type
Unknown
Estimated Equity
-$756,765,832

Purchase Details

Closed on
Dec 10, 2012
Sold by
Familia Blanca Lp
Bought by
Thr Nevada Ii Lp

Purchase Details

Closed on
Dec 21, 2005
Sold by
Villages At Wine Ridge Llc
Bought by
Familia Blanca Lp
Source: Public Records

Range of Values:

Collateral Analytics

Collateral Analytics Collateral Analytics AVMs (Automated Valuation Model) employ a number of statistical approaches combined with neighborhood-specific comparable selection guarantees the most up-to-date and precise valuations.

Not Available

Collateral Analytics does not have data for the current month. Please view the chart for historical values.

ICE

ICE Mortgage Technology ICE Mortgage Technology’s AVM (Automated Valuation Model) is a state-of-the-art online residential property valuation tool that provides a quick and accurate estimate of the value of almost any home in the U.S.

Not Available

ICE Mortgage Technology does not have data for the current month. Please view the chart for historical values.

First American

First American First American Data & Analytics’ next-generation AVM combines unrivaled data assets with a blended ensemble of valuation models to produce highly accurate, reliable valuations you can trust.

Not Available

First American does not have data for the current month. Please view the chart for historical values.

Quantarium

Quantarium Quantarium’s valuation service, repeatedly proven the industry’s most accurate and comprehensive, is supercharged with a self-learning and auto-tuning AI engine that continually becomes smarter and more accurate as it processes daily inputs from the industry’s leading RE data lake.

Not Available

Quantarium does not have data for the current month. Please view the chart for historical values.

Average Value
Not Available
List Price
Sold Price
Create a Home Valuation Report for This Property
The Home Valuation Report is an in-depth analysis detailing your home's value as well as a comparison with similar homes in the area

Home Values in the Area

Source: Public Records

Average Home Value in this Area


Source: Public Records

Purchase History

Date Buyer Sale Price Title Company
2014 & 1 Ih Borrower Lp -- None Available
201 1 Ih Equity Owner Lp -- None Available
2014 1 Ih Property Holdco Lp -- None Available
Thr Property Guarantor Lp -- None Available
Thr Nevada Ii Lp $169,000 Nevada Title Las Vegas
Familia Blanca Lp $320,000 Nevada Title Company
Source: Public Records

Mortgage History

Date Status Borrower Loan Amount
Open 2014 1 Ih Property Holdco Lp $993,738,000
Source: Public Records

Property History

Date Event Price List to Sale Price per Sq Ft
03/25/2013 03/25/13 For Rent $1,200 0.0% --
03/25/2013 03/25/13 Rented $1,200 -- --

Tax History Compared to Growth

Source: Public Records

Tax History

Year Tax Paid Tax Assessment Tax Assessment Total Assessment is a certain percentage of the fair market value that is determined by local assessors to be the total taxable value of land and additions on the property. Land Improvement
2025 $2,821 $124,626 $38,500 $86,126
2024 $2,613 $124,626 $38,500 $86,126
2023 $2,613 $114,305 $33,250 $81,055
2022 $2,419 $100,073 $26,250 $73,823
2021 $2,240 $96,347 $26,250 $70,097
2020 $2,077 $95,648 $26,250 $69,398
2019 $1,947 $89,228 $21,000 $68,228
2018 $1,858 $78,728 $18,200 $60,528
2017 $2,096 $71,455 $17,500 $53,955
2016 $1,739 $65,862 $13,300 $52,562
2015 $1,735 $67,850 $11,550 $56,300
2014 $1,690 $55,899 $6,650 $49,249
Source: Public Records

Agents Affiliated with this Home

  • Section Image
  • Section Image
See All Agents

Map