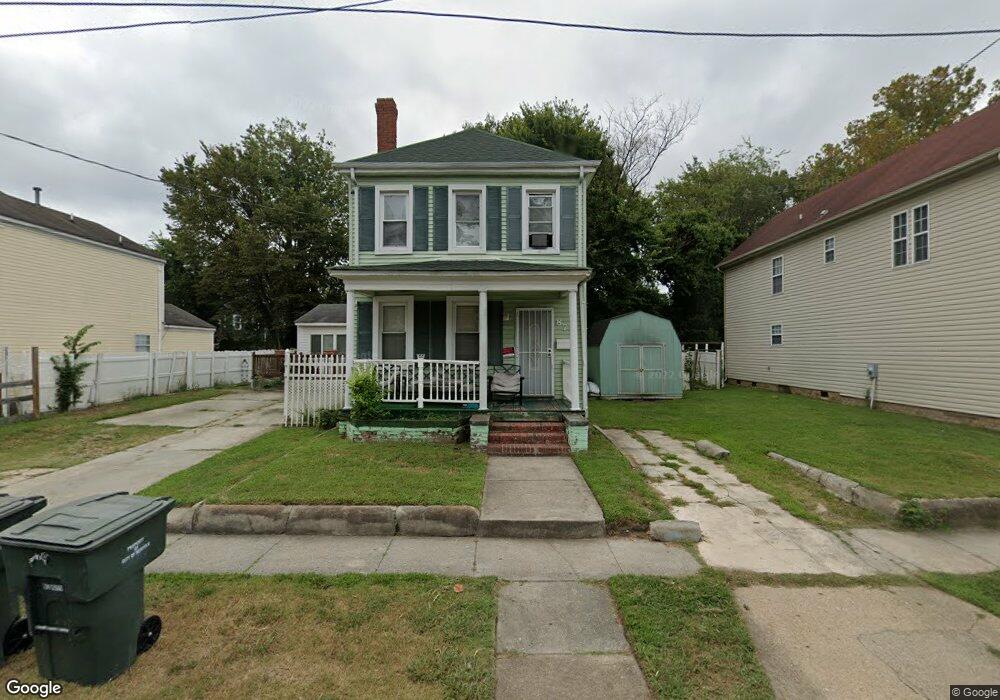
879 A Ave Norfolk, VA 23504
Olde Huntersville NeighborhoodEstimated Value: $227,000 - $270,951
3
Beds
2
Baths
2,200
Sq Ft
$115/Sq Ft
Est. Value
About This Home
This home is located at 879 A Ave, Norfolk, VA 23504 and is currently estimated at $253,238, approximately $115 per square foot. 879 A Ave is a home located in Norfolk City with nearby schools including Jacox Elementary School, Blair Middle School, and Granby High School.
Ownership History
Date
Name
Owned For
Owner Type
Purchase Details
Closed on
Mar 15, 2024
Sold by
Hazel & Associates Ii Llc
Bought by
Geth Tutankhamun and Stewart Gaea
Current Estimated Value
Home Financials for this Owner
Home Financials are based on the most recent Mortgage that was taken out on this home.
Original Mortgage
$250,381
Interest Rate
7.25%
Mortgage Type
FHA
Purchase Details
Closed on
Jan 18, 2023
Sold by
Samuel I White Pc
Bought by
Hazel & Associates Ii Llc
Purchase Details
Closed on
Sep 4, 2012
Sold by
City Of Norfolk
Bought by
Robinson Henrine W
Create a Home Valuation Report for This Property
The Home Valuation Report is an in-depth analysis detailing your home's value as well as a comparison with similar homes in the area
Home Values in the Area
Average Home Value in this Area
Purchase History
| Date | Buyer | Sale Price | Title Company |
|---|---|---|---|
| Geth Tutankhamun | $255,000 | Fortis Title | |
| Hazel & Associates Ii Llc | $96,000 | -- | |
| Robinson Henrine W | -- | None Available |
Source: Public Records
Mortgage History
| Date | Status | Borrower | Loan Amount |
|---|---|---|---|
| Previous Owner | Geth Tutankhamun | $250,381 |
Source: Public Records
Tax History Compared to Growth
Tax History
| Year | Tax Paid | Tax Assessment Tax Assessment Total Assessment is a certain percentage of the fair market value that is determined by local assessors to be the total taxable value of land and additions on the property. | Land | Improvement |
|---|---|---|---|---|
| 2025 | $2,393 | $191,400 | $29,500 | $161,900 |
| 2024 | $2,209 | $179,600 | $29,500 | $150,100 |
| 2023 | $2,153 | $172,200 | $29,500 | $142,700 |
| 2022 | $1,909 | $152,700 | $20,400 | $132,300 |
| 2021 | $1,724 | $137,900 | $17,000 | $120,900 |
| 2020 | $1,724 | $137,900 | $17,000 | $120,900 |
| 2019 | $1,559 | $124,700 | $17,000 | $107,700 |
| 2018 | $1,525 | $122,000 | $17,000 | $105,000 |
| 2017 | $1,392 | $121,000 | $17,000 | $104,000 |
| 2016 | $1,367 | $111,400 | $17,000 | $94,400 |
| 2015 | $1,283 | $111,400 | $17,000 | $94,400 |
| 2014 | $1,283 | $111,400 | $17,000 | $94,400 |
Source: Public Records
Map
Nearby Homes