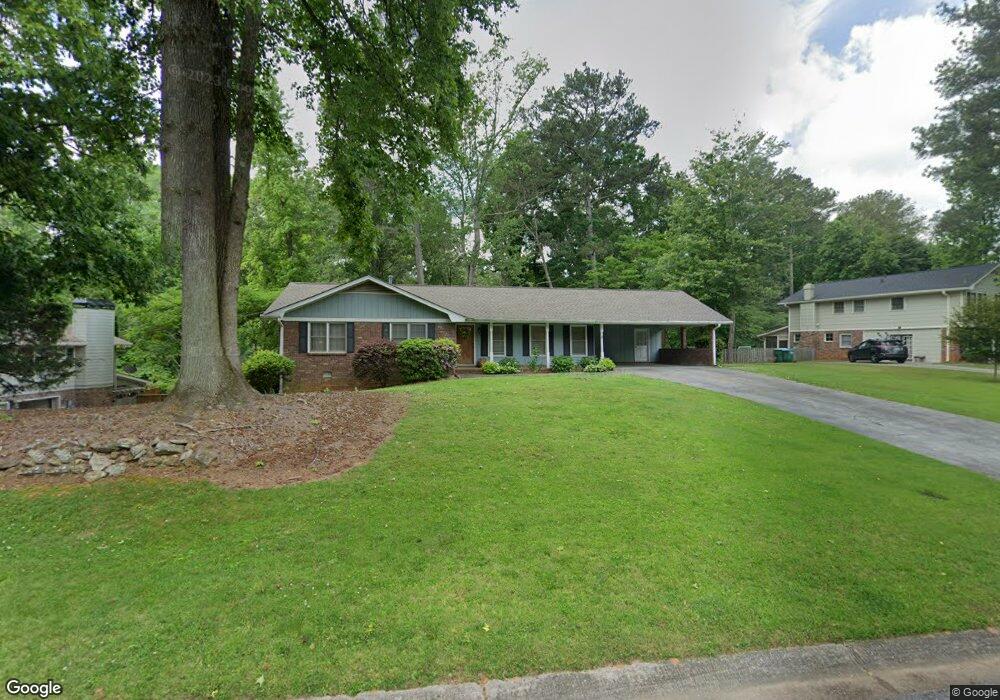
879 Bradford Ct SW Lilburn, GA 30047
Estimated Value: $361,000 - $385,000
4
Beds
2
Baths
1,592
Sq Ft
$232/Sq Ft
Est. Value
About This Home
This home is located at 879 Bradford Ct SW, Lilburn, GA 30047 and is currently estimated at $369,712, approximately $232 per square foot. 879 Bradford Ct SW is a home located in Gwinnett County with nearby schools including Camp Creek Elementary School, Trickum Middle School, and Parkview High School.
Ownership History
Date
Name
Owned For
Owner Type
Purchase Details
Closed on
Apr 30, 2018
Sold by
Fay Kevin J
Bought by
Lowery Aimee J
Current Estimated Value
Home Financials for this Owner
Home Financials are based on the most recent Mortgage that was taken out on this home.
Original Mortgage
$196,377
Outstanding Balance
$168,518
Interest Rate
4.44%
Mortgage Type
FHA
Estimated Equity
$201,194
Purchase Details
Closed on
Jun 27, 2005
Sold by
Fay Kevin J
Bought by
Fay Kevin J and Fay Ellen
Home Financials for this Owner
Home Financials are based on the most recent Mortgage that was taken out on this home.
Original Mortgage
$140,000
Interest Rate
5.21%
Mortgage Type
Stand Alone Second
Purchase Details
Closed on
May 26, 2004
Sold by
Hightower Harold F and Hightower Jacqueline
Bought by
Fay Kevin J
Home Financials for this Owner
Home Financials are based on the most recent Mortgage that was taken out on this home.
Original Mortgage
$139,360
Interest Rate
5.89%
Mortgage Type
New Conventional
Create a Home Valuation Report for This Property
The Home Valuation Report is an in-depth analysis detailing your home's value as well as a comparison with similar homes in the area
Home Values in the Area
Average Home Value in this Area
Purchase History
| Date | Buyer | Sale Price | Title Company |
|---|---|---|---|
| Lowery Aimee J | $200,000 | -- | |
| Fay Kevin J | -- | -- | |
| Fay Kevin J | $174,200 | -- |
Source: Public Records
Mortgage History
| Date | Status | Borrower | Loan Amount |
|---|---|---|---|
| Open | Lowery Aimee J | $196,377 | |
| Previous Owner | Fay Kevin J | $140,000 | |
| Previous Owner | Fay Kevin J | $139,360 |
Source: Public Records
Tax History Compared to Growth
Tax History
| Year | Tax Paid | Tax Assessment Tax Assessment Total Assessment is a certain percentage of the fair market value that is determined by local assessors to be the total taxable value of land and additions on the property. | Land | Improvement |
|---|---|---|---|---|
| 2025 | $5,666 | $150,160 | $26,120 | $124,040 |
| 2024 | $4,964 | $128,600 | $26,120 | $102,480 |
| 2023 | $4,964 | $140,640 | $27,200 | $113,440 |
| 2022 | $4,785 | $124,600 | $19,600 | $105,000 |
| 2021 | $3,938 | $99,320 | $19,600 | $79,720 |
| 2020 | $3,505 | $86,800 | $15,600 | $71,200 |
| 2019 | $3,099 | $78,840 | $15,600 | $63,240 |
| 2018 | $3,007 | $76,200 | $16,400 | $59,800 |
| 2016 | $2,500 | $61,240 | $12,000 | $49,240 |
| 2015 | $2,242 | $53,280 | $8,000 | $45,280 |
| 2014 | $2,253 | $53,280 | $8,000 | $45,280 |
Source: Public Records
Map
Nearby Homes
- 4271 Weston Dr SW
- 4367 Cedar Wood Dr SW
- 4254 Cedar Creek Trail SW Unit 8
- 4307 Cedar Wood Dr SW
- 4245 Cedar Creek Trail SW
- 1017 Rolling Forest Ln
- 871 Cedar Trace SW
- 4449 Amberleaf Walk
- 676 Killian Hill Rd SW
- 753 Brookwood Terrace SW
- 1296 Mandalay Ct SW
- 772 Brookwood Terrace SW
- 1093 Hasty Ct SW
- 4406 Hale Dr SW
- 4582 Warrior Trail SW
- 551 Killian Hill Rd SW
- 889 Bradford Ct SW
- 869 Bradford Ct SW Unit 2
- 899 Bradford Ct SW Unit 2
- 859 Bradford Ct SW
- 4343 Dunriver Dr SW
- 878 Bradford Ct SW
- 4333 Dunriver Dr SW Unit 6
- 4353 Dunriver Dr SW
- 888 Bradford Ct SW
- 903 Bradford Ct SW
- 858 Bradford Ct SW Unit 2
- 849 Bradford Ct SW Unit 2
- 4363 Dunriver Dr SW
- 4323 Dunriver Dr SW
- 907 Bradford Ct SW
- 908 Bradford Ct SW
- 839 Bradford Ct SW
- 4294 Cedar Creek Dr SW
- 4373 Dunriver Dr SW
- 911 Bradford Ct SW