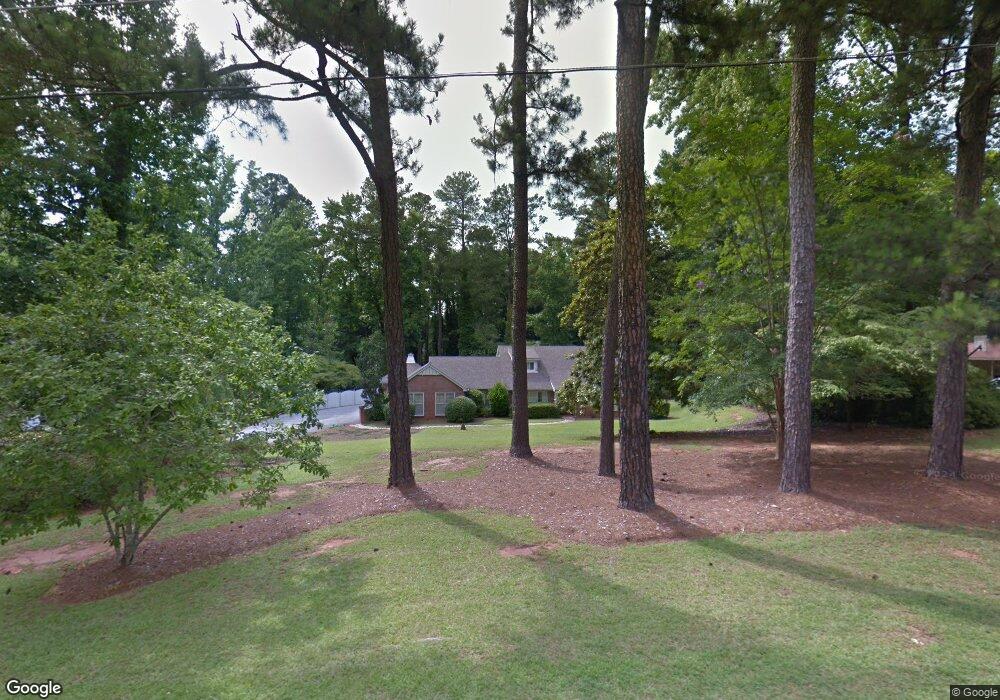
879 Lakewood Dr Lagrange, GA 30240
Estimated Value: $496,640 - $571,000
4
Beds
3
Baths
3,671
Sq Ft
$143/Sq Ft
Est. Value
About This Home
This home is located at 879 Lakewood Dr, Lagrange, GA 30240 and is currently estimated at $526,660, approximately $143 per square foot. 879 Lakewood Dr is a home located in Troup County with nearby schools including Hollis Hand Elementary School, Franklin Forest Elementary School, and Ethel W. Kight Elementary School.
Ownership History
Date
Name
Owned For
Owner Type
Purchase Details
Closed on
Jul 24, 2020
Sold by
Hall Amy F
Bought by
Nielsen Paul Anders and Nielsen Rhonda
Current Estimated Value
Purchase Details
Closed on
Jan 14, 2003
Sold by
Hall Amy
Bought by
Hall John G
Purchase Details
Closed on
Jan 22, 1998
Sold by
John Hall
Bought by
Hall Amy
Purchase Details
Closed on
Sep 30, 1996
Sold by
Richard Mallory
Bought by
John Hall
Purchase Details
Closed on
Jun 18, 1990
Sold by
Chloe Wm E and Chloe Frantz
Bought by
Richard Mallory
Purchase Details
Closed on
Sep 19, 1985
Sold by
Willimon Eugene P and Willimon Atricia
Bought by
Chloe Wm E and Chloe Frantz
Purchase Details
Closed on
Apr 30, 1979
Sold by
Sue A Long
Bought by
Willimon Eugene P and Willimon Atricia
Purchase Details
Closed on
Jan 26, 1978
Sold by
Byron C Stuart
Bought by
Sue A Long
Purchase Details
Closed on
Jun 5, 1976
Sold by
Hurst
Bought by
Byron C Stuart
Purchase Details
Closed on
Jan 1, 1962
Sold by
Jane Hurst
Bought by
Hurst
Create a Home Valuation Report for This Property
The Home Valuation Report is an in-depth analysis detailing your home's value as well as a comparison with similar homes in the area
Home Values in the Area
Average Home Value in this Area
Purchase History
| Date | Buyer | Sale Price | Title Company |
|---|---|---|---|
| Nielsen Paul Anders | $345,000 | -- | |
| Hall John G | -- | -- | |
| Hall Amy | -- | -- | |
| John Hall | $235,000 | -- | |
| Richard Mallory | $163,000 | -- | |
| Chloe Wm E | $207,000 | -- | |
| Willimon Eugene P | -- | -- | |
| Sue A Long | -- | -- | |
| Byron C Stuart | -- | -- | |
| Hurst | -- | -- |
Source: Public Records
Tax History Compared to Growth
Tax History
| Year | Tax Paid | Tax Assessment Tax Assessment Total Assessment is a certain percentage of the fair market value that is determined by local assessors to be the total taxable value of land and additions on the property. | Land | Improvement |
|---|---|---|---|---|
| 2024 | $4,893 | $179,400 | $26,000 | $153,400 |
| 2023 | $4,863 | $178,320 | $26,000 | $152,320 |
| 2022 | $4,235 | $151,720 | $26,000 | $125,720 |
| 2021 | $3,978 | $131,880 | $26,000 | $105,880 |
| 2020 | $3,546 | $117,560 | $26,000 | $91,560 |
| 2019 | $3,402 | $112,800 | $20,000 | $92,800 |
| 2018 | $3,268 | $108,360 | $20,000 | $88,360 |
| 2017 | $3,246 | $107,640 | $20,000 | $87,640 |
| 2016 | $3,036 | $100,647 | $20,000 | $80,647 |
| 2015 | $3,041 | $100,647 | $20,000 | $80,647 |
| 2014 | $2,995 | $98,984 | $20,000 | $78,984 |
| 2013 | -- | $99,675 | $20,000 | $79,675 |
Source: Public Records
Map
Nearby Homes
- 203 S Chilton Crescent
- 201 S Chilton Crescent
- 748 Lakewood Dr
- 724 Camellia Dr
- 102 Ewing St
- 106 Ewing St
- 106 S Chilton Crescent
- 145 Turner St
- 100 Creekside Dr Unit LOT 60A
- 603 Country Club Rd
- 107 Dixie Creek Dr
- 705 Piney Woods Dr
- 609 Cherokee Rd
- 104 Sweetgum Dr
- 204 Colonial St
- 110 Russell St
- 109 Thomas St
- 900 North St
- 219 Banks St
- 105 Saynor Cir
- 871 Lakewood Dr
- 881 Lakewood Dr
- 1021 Peninsula Dr
- 855 Lakewood Dr
- 901 Lakewood Dr
- 880 Lakewood Dr
- 1025 Peninsula Dr
- 1019 Peninsula Dr
- 878 Lakewood Dr
- 906 Lakewood Dr
- 0 Peninsula Dr Unit 1 7490816
- 0 Peninsula Dr Unit 8192617
- 0 Peninsula Dr Unit 8481288
- 0 Peninsula Dr Unit 8484331
- 839 Azalea Dr
- 905 Lakewood Dr
- 869 Lakewood Dr
- 1014 Peninsula Dr
- 1027 Peninsula Dr
- 868 Lakewood Dr