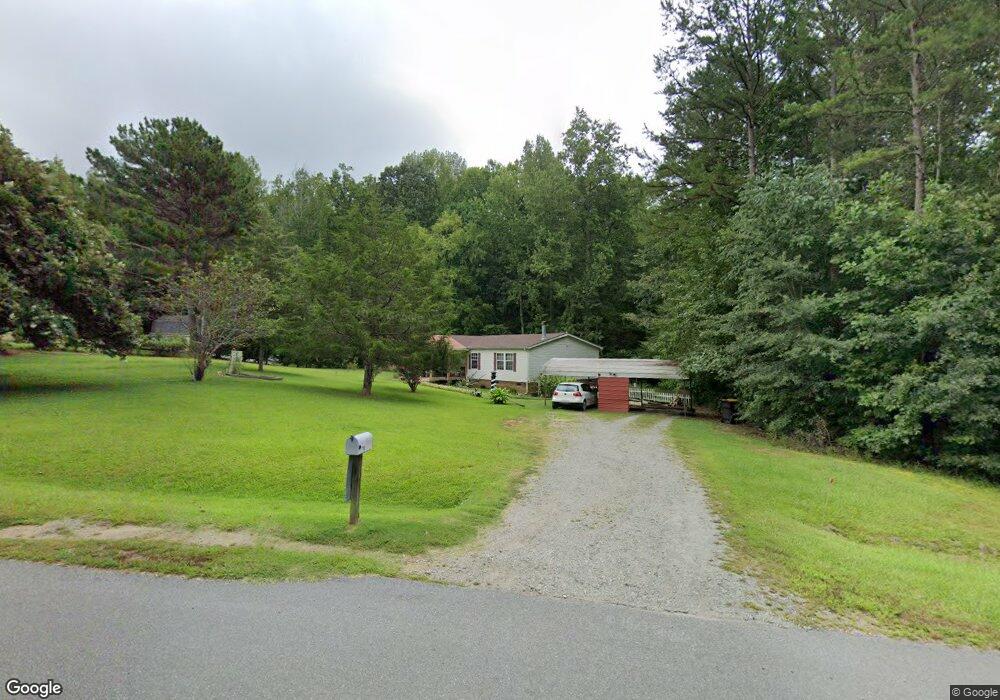
879 Monterey Dr Iron Station, NC 28080
Estimated Value: $175,496 - $241,000
3
Beds
2
Baths
1,498
Sq Ft
$144/Sq Ft
Est. Value
About This Home
This home is located at 879 Monterey Dr, Iron Station, NC 28080 and is currently estimated at $216,374, approximately $144 per square foot. 879 Monterey Dr is a home located in Lincoln County with nearby schools including Catawba Springs Elementary School, East Lincoln Middle School, and East Lincoln High School.
Ownership History
Date
Name
Owned For
Owner Type
Purchase Details
Closed on
Mar 28, 2014
Sold by
Champion Robert P
Bought by
Culbertson Debra K
Current Estimated Value
Home Financials for this Owner
Home Financials are based on the most recent Mortgage that was taken out on this home.
Original Mortgage
$36,000
Outstanding Balance
$10,811
Interest Rate
4.3%
Mortgage Type
New Conventional
Estimated Equity
$205,563
Purchase Details
Closed on
Aug 30, 2007
Sold by
Clyburn Leroy
Bought by
Champion Robert P
Home Financials for this Owner
Home Financials are based on the most recent Mortgage that was taken out on this home.
Original Mortgage
$50,000
Interest Rate
6.65%
Mortgage Type
New Conventional
Purchase Details
Closed on
Jul 16, 2003
Bought by
Clyburn Leroy
Create a Home Valuation Report for This Property
The Home Valuation Report is an in-depth analysis detailing your home's value as well as a comparison with similar homes in the area
Home Values in the Area
Average Home Value in this Area
Purchase History
| Date | Buyer | Sale Price | Title Company |
|---|---|---|---|
| Culbertson Debra K | $73,000 | The Title Company Of Nc | |
| Champion Robert P | $82,000 | None Available | |
| Clyburn Leroy | $21,500 | -- |
Source: Public Records
Mortgage History
| Date | Status | Borrower | Loan Amount |
|---|---|---|---|
| Open | Culbertson Debra K | $36,000 | |
| Previous Owner | Champion Robert P | $50,000 |
Source: Public Records
Tax History Compared to Growth
Tax History
| Year | Tax Paid | Tax Assessment Tax Assessment Total Assessment is a certain percentage of the fair market value that is determined by local assessors to be the total taxable value of land and additions on the property. | Land | Improvement |
|---|---|---|---|---|
| 2025 | $556 | $154,282 | $35,880 | $118,402 |
| 2024 | $546 | $154,282 | $35,880 | $118,402 |
| 2023 | $533 | $154,282 | $35,880 | $118,402 |
| 2022 | $406 | $92,495 | $29,304 | $63,191 |
| 2021 | $406 | $92,495 | $29,304 | $63,191 |
| 2020 | $339 | $92,495 | $29,304 | $63,191 |
| 2019 | $339 | $92,495 | $29,304 | $63,191 |
| 2018 | $335 | $75,808 | $26,804 | $49,004 |
| 2017 | $552 | $75,808 | $26,804 | $49,004 |
| 2016 | $552 | $75,808 | $26,804 | $49,004 |
| 2015 | $626 | $75,808 | $26,804 | $49,004 |
| 2014 | $692 | $86,084 | $31,803 | $54,281 |
Source: Public Records
Map
Nearby Homes
- 1785 Doe Ct
- 1789 Doe Ct
- 1615 Oak Park Ct
- 450 Greywalls Ln
- 0 Highway 73 Hwy Unit CAR4276388
- 269 Wester Brewlands Rd
- 0 Wolf Rd Unit 8
- 5756 Rumfelt Rd
- 5759 Rumfelt Rd
- 5716 Dalmatian St
- 343 Wester Brewlands Rd
- Lot #42 Sardis Ct
- 0 Mariposa Rd Unit CAR4247367
- 0 Mariposa Rd Unit CAR4237549
- 5748 Dalmatian St
- 5756 Dalmatian St
- 2805 Sadler Rd
- 0 Lhasa Apso Ln Unit CAR4157960
- 0 Lhasa Apso Ln Unit CAR4157956
- 0 Dalmatian St Unit CAR4157812
- 869 Monterey Dr
- 855 Monterey Dr
- 870 Monterey Dr
- 899 Monterey Dr
- 858 Monterey Dr
- 841 Monterey Dr
- 846 Monterey Dr
- 827 Monterey Dr
- 832 Monterey Dr
- 934 Monterey Dr
- 818 Monterey Dr
- 946 Monterey Dr
- 804 Monterey Dr
- 775 Spring Creek Dr
- 953 Monterey Dr
- 797 Monterey Dr
- 960 Monterey Dr
- 782 Monterey Dr
- 783 Monterey Dr
- 774 Spring Creek Dr