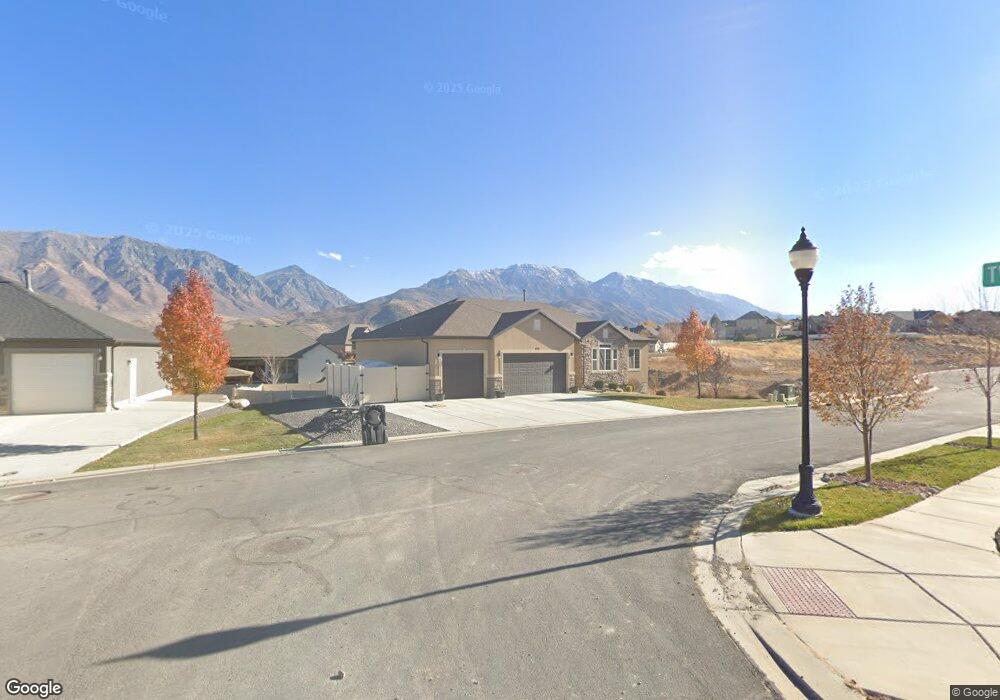
879 Sunset Dr Santaquin, UT 84655
Estimated Value: $578,000 - $635,000
3
Beds
3
Baths
3,378
Sq Ft
$182/Sq Ft
Est. Value
About This Home
This home is located at 879 Sunset Dr, Santaquin, UT 84655 and is currently estimated at $613,403, approximately $181 per square foot. 879 Sunset Dr is a home located in Utah County with nearby schools including Santaquin Elementary School, Payson Junior High School, and Mt. Nebo Middle.
Ownership History
Date
Name
Owned For
Owner Type
Purchase Details
Closed on
Jul 27, 2020
Sold by
Hickman Kyle and Hickman Amy
Bought by
Hickman Amy and Hickman Kyle
Current Estimated Value
Purchase Details
Closed on
Aug 9, 2017
Sold by
Curtis Raymond G and Curtis Tina M
Bought by
Hickman Kyle and Hickman Amy
Home Financials for this Owner
Home Financials are based on the most recent Mortgage that was taken out on this home.
Original Mortgage
$318,250
Outstanding Balance
$264,980
Interest Rate
3.88%
Estimated Equity
$348,423
Purchase Details
Closed on
Jun 24, 2015
Sold by
Central Bank
Bought by
Salisbury Developers Inc
Home Financials for this Owner
Home Financials are based on the most recent Mortgage that was taken out on this home.
Original Mortgage
$223,200
Interest Rate
3.81%
Mortgage Type
Small Business Administration
Purchase Details
Closed on
Sep 29, 2011
Sold by
Summit Ridge Communities Llc
Bought by
Central Bank
Create a Home Valuation Report for This Property
The Home Valuation Report is an in-depth analysis detailing your home's value as well as a comparison with similar homes in the area
Home Values in the Area
Average Home Value in this Area
Purchase History
| Date | Buyer | Sale Price | Title Company |
|---|---|---|---|
| Hickman Amy | -- | Inwest Title Svcs Salt La | |
| Hickman Kyle | -- | United West Title | |
| Salisbury Developers Inc | -- | Gt Title Services | |
| Central Bank | -- | None Available |
Source: Public Records
Mortgage History
| Date | Status | Borrower | Loan Amount |
|---|---|---|---|
| Open | Hickman Kyle | $318,250 | |
| Previous Owner | Salisbury Developers Inc | $223,200 |
Source: Public Records
Tax History Compared to Growth
Tax History
| Year | Tax Paid | Tax Assessment Tax Assessment Total Assessment is a certain percentage of the fair market value that is determined by local assessors to be the total taxable value of land and additions on the property. | Land | Improvement |
|---|---|---|---|---|
| 2025 | $2,885 | $569,800 | $173,600 | $396,200 |
| 2024 | $2,885 | $287,320 | $0 | $0 |
| 2023 | $3,031 | $302,830 | $0 | $0 |
| 2022 | $2,857 | $294,415 | $0 | $0 |
| 2021 | $2,490 | $397,800 | $103,600 | $294,200 |
| 2020 | $2,306 | $356,900 | $74,000 | $282,900 |
| 2019 | $1,997 | $316,100 | $70,100 | $246,000 |
| 2018 | $1,846 | $278,600 | $64,700 | $213,900 |
| 2017 | $1,710 | $137,885 | $0 | $0 |
| 2016 | $1,604 | $126,775 | $0 | $0 |
| 2015 | $604 | $46,800 | $0 | $0 |
| 2014 | $555 | $42,900 | $0 | $0 |
Source: Public Records
Map
Nearby Homes
- 926 S Tanner Rd
- 1022 Vista Ridge Dr Unit 149
- 1103 Vista Ridge Dr
- 1144 Crest Dale Ln
- 583 Sunset Dr
- 1217 Crest Dale Ln
- 1208 Crest Dale Ln
- 633 Little Rock Dr
- 1226 Crest Dale Ln
- 1263 Crest Dale Ln
- 1260 Crest Dale Ln
- 1267 W View Dr
- 1858 W View Cove
- 490 Firestone Dr
- 1859 W View Cove
- 1851 W View Cove
- 519 Stone Way
- 1276 W View Dr
- 1302 W View Dr
- 402 Topaz Dr
- 863 Sunset Dr
- 892 Valley View Dr Unit 103
- 904 Valley View Dr
- 880 Sunset Dr
- 849 Sunset Dr
- 878 Valley View Dr
- 861 Twilight Way
- 918 Valley View Dr
- 831 Sunset Dr
- 831 Sunset Dr Unit AUBREY
- 852 Twilight Way Unit 54A
- 855 Twilight Way Unit MORRIS
- 834 Sunset Dr Unit DREXEL
- 885 Valley View Dr
- 830 Sunset Cove
- 872 Valley View Dr
- 934 Valley View Dr
- 915 Valley View Dr
- 851 Twilight Way
- 818 Sunset Dr Unit 65