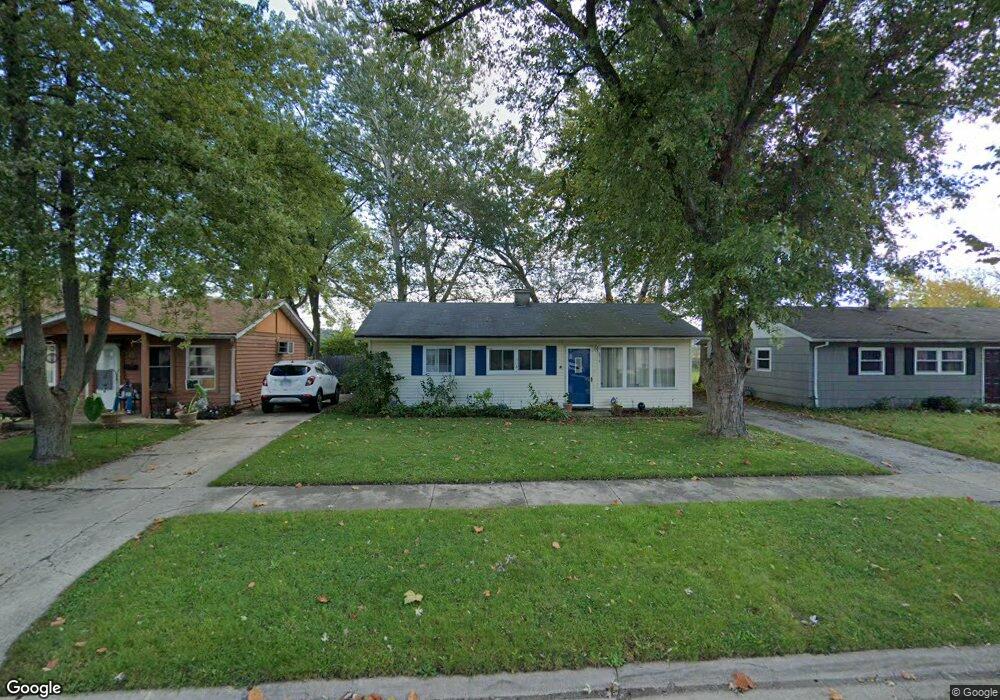
879 Taylor Ave Aurora, IL 60506
North River NeighborhoodEstimated Value: $235,000 - $243,855
3
Beds
1
Bath
864
Sq Ft
$277/Sq Ft
Est. Value
About This Home
This home is located at 879 Taylor Ave, Aurora, IL 60506 and is currently estimated at $239,214, approximately $276 per square foot. 879 Taylor Ave is a home located in Kane County with nearby schools including Mccleery Elementary School, Jefferson Middle School, and West Aurora High School.
Ownership History
Date
Name
Owned For
Owner Type
Purchase Details
Closed on
Jul 29, 2005
Sold by
Contreras Jose and Vargas Antonia
Bought by
Gaskin Ruby
Current Estimated Value
Home Financials for this Owner
Home Financials are based on the most recent Mortgage that was taken out on this home.
Original Mortgage
$117,600
Outstanding Balance
$68,132
Interest Rate
7.3%
Mortgage Type
Purchase Money Mortgage
Estimated Equity
$171,082
Purchase Details
Closed on
Nov 26, 2003
Sold by
Frankford Debra L
Bought by
Contreras Jose and Vargas Antonia
Home Financials for this Owner
Home Financials are based on the most recent Mortgage that was taken out on this home.
Original Mortgage
$129,900
Interest Rate
6.01%
Mortgage Type
Purchase Money Mortgage
Create a Home Valuation Report for This Property
The Home Valuation Report is an in-depth analysis detailing your home's value as well as a comparison with similar homes in the area
Home Values in the Area
Average Home Value in this Area
Purchase History
| Date | Buyer | Sale Price | Title Company |
|---|---|---|---|
| Gaskin Ruby | $147,000 | Ticor Title Insurance Co | |
| Contreras Jose | $130,000 | Greater Illinois Title Compa |
Source: Public Records
Mortgage History
| Date | Status | Borrower | Loan Amount |
|---|---|---|---|
| Open | Gaskin Ruby | $117,600 | |
| Previous Owner | Contreras Jose | $129,900 |
Source: Public Records
Tax History
| Year | Tax Paid | Tax Assessment Tax Assessment Total Assessment is a certain percentage of the fair market value that is determined by local assessors to be the total taxable value of land and additions on the property. | Land | Improvement |
|---|---|---|---|---|
| 2024 | $4,400 | $63,567 | $8,327 | $55,240 |
| 2023 | $4,180 | $56,797 | $7,440 | $49,357 |
| 2022 | $4,056 | $51,822 | $6,788 | $45,034 |
| 2021 | $3,638 | $45,822 | $6,320 | $39,502 |
| 2020 | $3,423 | $42,561 | $5,870 | $36,691 |
| 2019 | $3,269 | $39,434 | $5,439 | $33,995 |
| 2018 | $2,932 | $35,366 | $5,031 | $30,335 |
| 2017 | $2,464 | $29,937 | $4,636 | $25,301 |
| 2016 | $2,129 | $26,042 | $3,974 | $22,068 |
| 2015 | -- | $26,077 | $3,417 | $22,660 |
| 2014 | -- | $23,257 | $3,140 | $20,117 |
| 2013 | -- | $23,752 | $3,095 | $20,657 |
Source: Public Records
Map
Nearby Homes
- 837 Taylor Ave
- 847 Foran Ln
- 833 Sheldon Ave
- 732 N Fordham Ave
- 1039 S Pleasure Ct
- 1061 S Pleasure Ct
- 424 N Lancaster Ave
- 1387 S Glen Cir Unit D
- 603 N May St
- 833 N Randall Rd Unit C4
- 418 W Illinois Ave
- 519 N View St
- 930 W New York St Unit 932
- 507 W Park Ave
- 338 Lakelawn Blvd
- 415 Blackhawk St
- 810 W Galena Blvd
- 1080 Scarlet Oak Cir
- 932 W New York St
- 659 W Downer Place
Your Personal Tour Guide
Ask me questions while you tour the home.