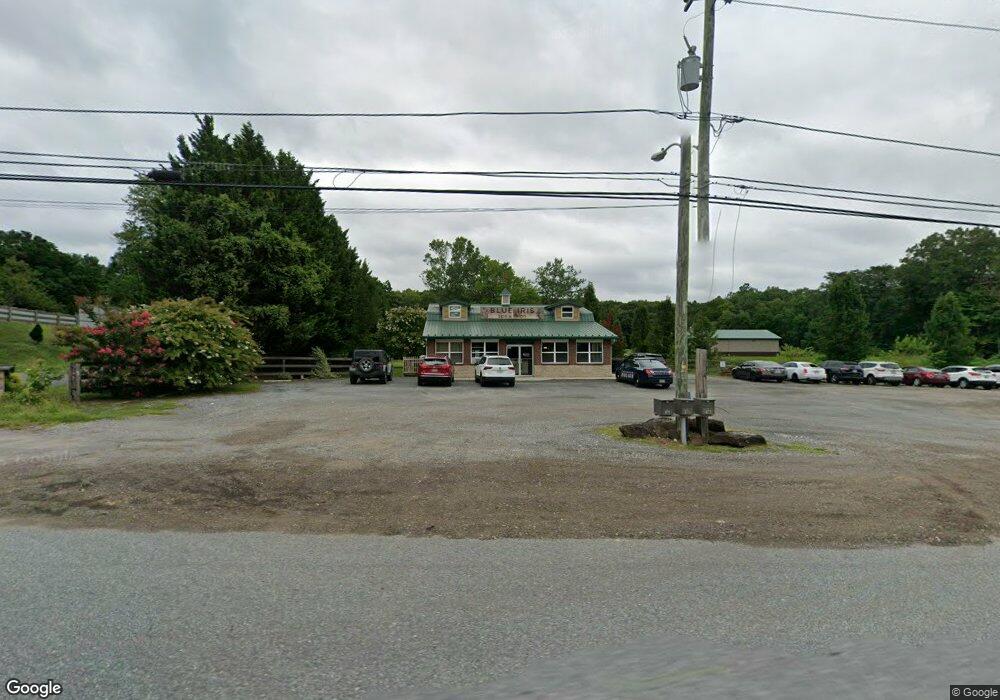
879 W Pulaski Hwy Elkton, MD 21921
Estimated Value: $1,660,371
--
Bed
--
Bath
1,280
Sq Ft
$1,297/Sq Ft
Est. Value
About This Home
This home is located at 879 W Pulaski Hwy, Elkton, MD 21921 and is currently estimated at $1,660,371, approximately $1,297 per square foot. 879 W Pulaski Hwy is a home located in Cecil County with nearby schools including Leeds Elementary School, Cherry Hill Middle School, and North East High School.
Ownership History
Date
Name
Owned For
Owner Type
Purchase Details
Closed on
May 20, 2022
Sold by
Cahill Ii Llc
Bought by
Cahill Iii Llc
Current Estimated Value
Purchase Details
Closed on
Jul 13, 2021
Sold by
Boulden Sherie L
Bought by
Cahill Ii Llc
Home Financials for this Owner
Home Financials are based on the most recent Mortgage that was taken out on this home.
Original Mortgage
$1,125,000
Interest Rate
2.96%
Mortgage Type
Credit Line Revolving
Purchase Details
Closed on
Jun 24, 2020
Sold by
Boulden Sherie L and Estate Of Christian A Boulden
Bought by
Boulden Christian A
Purchase Details
Closed on
Jul 27, 2017
Sold by
Johnston Winifred Coleman
Bought by
Boulden Christain A
Purchase Details
Closed on
May 2, 2011
Sold by
Johnston Winifred Coleman
Bought by
Johnston Winifred Coleman and Boulden Christian A
Create a Home Valuation Report for This Property
The Home Valuation Report is an in-depth analysis detailing your home's value as well as a comparison with similar homes in the area
Home Values in the Area
Average Home Value in this Area
Purchase History
| Date | Buyer | Sale Price | Title Company |
|---|---|---|---|
| Cahill Iii Llc | -- | Kirsh Title | |
| Cahill Ii Llc | $1,325,000 | Kirsh Title Services Inc | |
| Boulden Christian A | -- | Accommodation | |
| Boulden Christain A | -- | None Available | |
| Johnston Winifred Coleman | -- | -- |
Source: Public Records
Mortgage History
| Date | Status | Borrower | Loan Amount |
|---|---|---|---|
| Previous Owner | Cahill Ii Llc | $1,125,000 |
Source: Public Records
Tax History Compared to Growth
Tax History
| Year | Tax Paid | Tax Assessment Tax Assessment Total Assessment is a certain percentage of the fair market value that is determined by local assessors to be the total taxable value of land and additions on the property. | Land | Improvement |
|---|---|---|---|---|
| 2025 | $14,054 | $1,284,167 | $0 | $0 |
| 2024 | $13,927 | $1,272,600 | $979,200 | $293,400 |
| 2023 | $11,357 | $1,028,333 | $0 | $0 |
| 2022 | $8,891 | $784,067 | $0 | $0 |
| 2021 | $8,712 | $539,800 | $271,800 | $268,000 |
| 2020 | $6,014 | $516,233 | $0 | $0 |
| 2019 | $3,436 | $297,867 | $0 | $0 |
| 2018 | $3,217 | $273,700 | $217,400 | $56,300 |
| 2017 | $6,051 | $269,333 | $0 | $0 |
| 2016 | $5,968 | $543,000 | $0 | $0 |
| 2015 | $5,968 | $535,800 | $0 | $0 |
| 2014 | $6,820 | $535,800 | $0 | $0 |
Source: Public Records
Map
Nearby Homes
- 153 Nicholas Dr
- 1132 Nottingham Rd
- 1 Robin Hood Dr
- 61 Saint Michaels Ct
- 10 King Richard Dr
- Lot#2, Lot#3, Lot#4 Old Elk Neck Rd
- 10 Saddler Ave
- 360 Nottingham Rd
- 896 E Old Philadelphia Rd
- 2966 Old Elk Neck Rd
- 4043A Blue Ball Rd
- 2324 Oldfield Point Rd
- 25 Teatree Ln
- 9.85 ac Water Front Oldfield Point Rd
- 7 Olive Way
- 47 Olive Way
- 33 Juniper Cir
- 104 Magnolia Dr
- 117 Magnolia Dr
- 27 Juniper Cir
- 877 W Pulaski Hwy
- 899 W Pulaski Hwy
- 837 W Pulaski Hwy
- 895 W Pulaski Hwy
- 883 W Pulaski Hwy
- 833 W Pulaski Hwy
- 827 W Pulaski Hwy Unit A
- 827A W Pulaski Hwy
- 891 W Pulaski Hwy
- 823 W Pulaski Hwy
- 886 W Pulaski Hwy
- 872 W Pulaski Hwy
- 927 W Pulaski Hwy
- 896 W Pulaski Hwy
- 998 Nottingham Rd
- 791 W Pulaski Hwy
- 910 W Pulaski Hwy
- 960 Nottingham Rd
- 106 Orpah Dr
- 988 Nottingham Rd