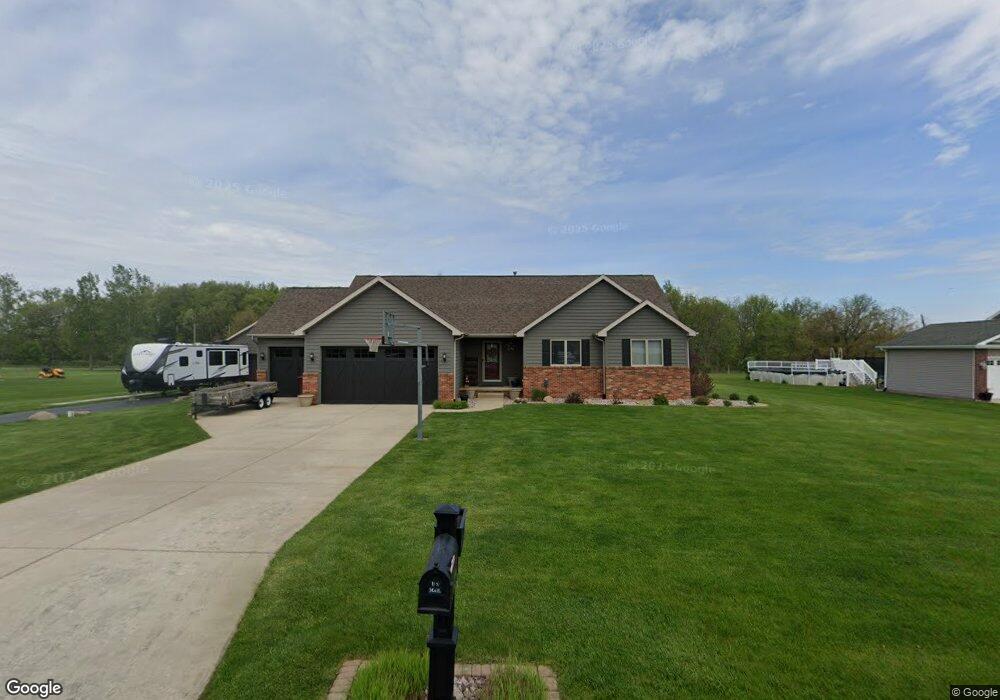
8790 W 156th Ave Lowell, IN 46356
West Creek NeighborhoodEstimated Value: $390,000 - $482,000
3
Beds
2
Baths
1,678
Sq Ft
$265/Sq Ft
Est. Value
About This Home
This home is located at 8790 W 156th Ave, Lowell, IN 46356 and is currently estimated at $445,151, approximately $265 per square foot. 8790 W 156th Ave is a home located in Lake County with nearby schools including Lowell Middle School and Lowell Senior High School.
Ownership History
Date
Name
Owned For
Owner Type
Purchase Details
Closed on
Oct 31, 2008
Sold by
James Brothers Inc
Bought by
Bennett Bobby L and Bennett Terry J
Current Estimated Value
Home Financials for this Owner
Home Financials are based on the most recent Mortgage that was taken out on this home.
Original Mortgage
$217,470
Outstanding Balance
$142,964
Interest Rate
6.11%
Mortgage Type
FHA
Estimated Equity
$302,187
Purchase Details
Closed on
Nov 13, 2006
Sold by
Pruim Edward H and Pruim Bernetta
Bought by
James Brothers Inc
Home Financials for this Owner
Home Financials are based on the most recent Mortgage that was taken out on this home.
Original Mortgage
$200,000
Interest Rate
6.41%
Mortgage Type
Purchase Money Mortgage
Purchase Details
Closed on
Jun 5, 2006
Sold by
Micic Ljuboje and Micic Shirley
Bought by
Pruim Edward H and Pruim Bernetta
Purchase Details
Closed on
Feb 23, 2006
Sold by
Pruim Edward H and Pruim Bernetta
Bought by
Micic Ljuboje and Micic Shirley
Create a Home Valuation Report for This Property
The Home Valuation Report is an in-depth analysis detailing your home's value as well as a comparison with similar homes in the area
Home Values in the Area
Average Home Value in this Area
Purchase History
| Date | Buyer | Sale Price | Title Company |
|---|---|---|---|
| Bennett Bobby L | -- | Chicago Title Insurance Co | |
| James Brothers Inc | -- | Chicago Title Insurance Co | |
| Pruim Edward H | -- | Chicago Title Insurance Co | |
| Micic Ljuboje | -- | Chicago Title Insurance Co |
Source: Public Records
Mortgage History
| Date | Status | Borrower | Loan Amount |
|---|---|---|---|
| Open | Bennett Bobby L | $217,470 | |
| Previous Owner | James Brothers Inc | $200,000 |
Source: Public Records
Tax History Compared to Growth
Tax History
| Year | Tax Paid | Tax Assessment Tax Assessment Total Assessment is a certain percentage of the fair market value that is determined by local assessors to be the total taxable value of land and additions on the property. | Land | Improvement |
|---|---|---|---|---|
| 2024 | $7,723 | $408,500 | $65,000 | $343,500 |
| 2023 | $3,501 | $409,900 | $65,000 | $344,900 |
| 2022 | $3,418 | $367,700 | $65,000 | $302,700 |
| 2021 | $2,850 | $322,000 | $55,000 | $267,000 |
| 2020 | $2,662 | $312,400 | $55,000 | $257,400 |
| 2019 | $2,642 | $297,000 | $55,000 | $242,000 |
| 2018 | $2,575 | $290,500 | $55,000 | $235,500 |
| 2017 | $2,696 | $283,900 | $55,000 | $228,900 |
| 2016 | $2,545 | $277,100 | $55,000 | $222,100 |
| 2014 | $2,545 | $279,600 | $55,000 | $224,600 |
| 2013 | $2,218 | $240,500 | $55,000 | $185,500 |
Source: Public Records
Map
Nearby Homes
- 9015 W 155th Ave
- 15517 Roberts St
- 9218 W 155th Ave
- 9715 157th Ave
- 15026 Drummond St
- The Hayes Plan at Lynnsway - The Cottage Homes at Lynnsway
- 9711 W 148th Place
- 7012 W 160th Place
- 14856A Carey St
- 16468 Parrish Ave
- 14745 Blaine St
- 14836A Carey St
- 6721 W 158th Place
- 6797 160th Place
- 6779 160th Place
- 6723 160th Place
- 6677 160th Place
- 6645 160th Place
- 6633 160th Place
- 6801 160th Place
- 8831 W 156th Ave
- 8740 W 156th Ave
- 8830 W 156th Ave
- 8691 W 156th Ave
- 8877 W 156th Ave
- 8690 W 156th Ave
- 8876 W 156th Ave
- 8832 W 156th Ct
- 8793 W 156th Ct
- 8793 W 156th Ct
- 8891 W 156th Ave
- 8833 W 156th Ct
- 15578 Truman St
- 8742 W 156th Ct
- 8890 W 156th Ave
- 8878 W 156th Ct
- 8792 W 156th Ct
- Lot 59 W 156th Ave
- 15526 Truman St
- 8692 W 156th Ct