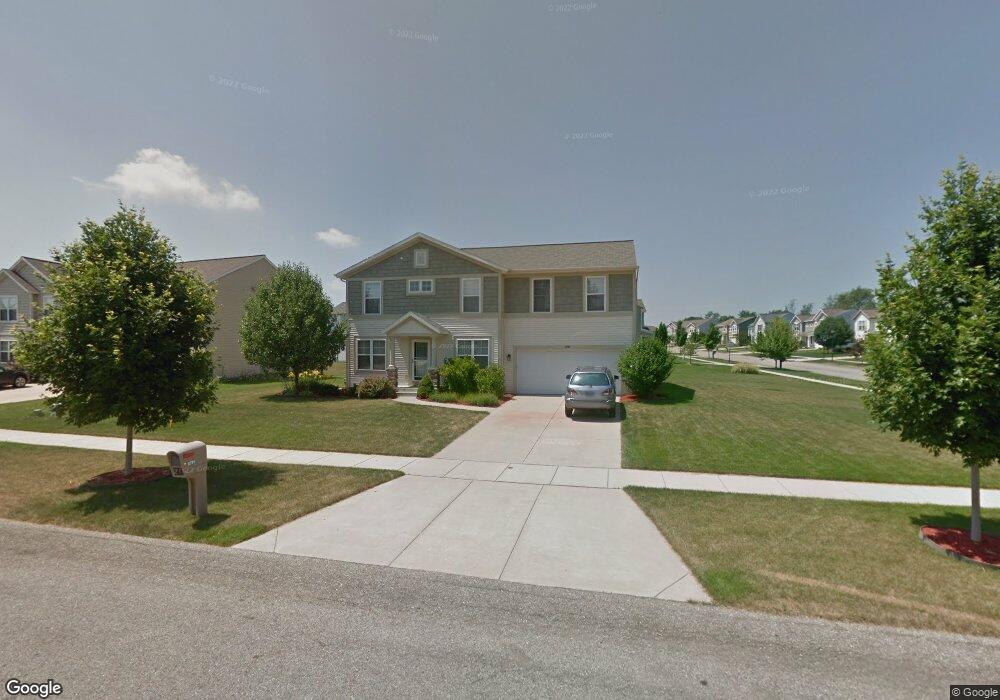
8791 Costner Dr SE Caledonia, MI 49316
Estimated Value: $480,497 - $557,000
5
Beds
4
Baths
3,500
Sq Ft
$145/Sq Ft
Est. Value
About This Home
This home is located at 8791 Costner Dr SE, Caledonia, MI 49316 and is currently estimated at $506,374, approximately $144 per square foot. 8791 Costner Dr SE is a home located in Kent County with nearby schools including Caledonia Elementary School, Emmons Lake Elementary School, and Kettle Lake Elementary School.
Ownership History
Date
Name
Owned For
Owner Type
Purchase Details
Closed on
Jun 16, 2011
Sold by
Lindemann Mike and Lindemann Jenna
Bought by
Steenwyk Mark and Steenwyk Sherry
Current Estimated Value
Home Financials for this Owner
Home Financials are based on the most recent Mortgage that was taken out on this home.
Original Mortgage
$213,300
Outstanding Balance
$146,561
Interest Rate
4.56%
Mortgage Type
New Conventional
Estimated Equity
$359,814
Purchase Details
Closed on
Apr 29, 2005
Sold by
Bosgraaf Builders Inc
Bought by
Lindemann Mike
Home Financials for this Owner
Home Financials are based on the most recent Mortgage that was taken out on this home.
Original Mortgage
$179,100
Interest Rate
6.05%
Mortgage Type
Fannie Mae Freddie Mac
Purchase Details
Closed on
Mar 30, 2004
Sold by
Bbz Ii Llc
Bought by
Bosgraaf Builders Inc
Create a Home Valuation Report for This Property
The Home Valuation Report is an in-depth analysis detailing your home's value as well as a comparison with similar homes in the area
Home Values in the Area
Average Home Value in this Area
Purchase History
| Date | Buyer | Sale Price | Title Company |
|---|---|---|---|
| Steenwyk Mark | $237,000 | Lighthouse Title Inc | |
| Lindemann Mike | $223,900 | Metropolitan Title Company | |
| Bosgraaf Builders Inc | $35,921 | Metropolitan Title Company |
Source: Public Records
Mortgage History
| Date | Status | Borrower | Loan Amount |
|---|---|---|---|
| Open | Steenwyk Mark | $213,300 | |
| Previous Owner | Lindemann Mike | $179,100 | |
| Closed | Lindemann Mike | $33,585 |
Source: Public Records
Tax History Compared to Growth
Tax History
| Year | Tax Paid | Tax Assessment Tax Assessment Total Assessment is a certain percentage of the fair market value that is determined by local assessors to be the total taxable value of land and additions on the property. | Land | Improvement |
|---|---|---|---|---|
| 2025 | $4,027 | $224,100 | $0 | $0 |
| 2024 | $4,027 | $203,300 | $0 | $0 |
| 2023 | $5,047 | $185,600 | $0 | $0 |
| 2022 | $4,864 | $162,400 | $0 | $0 |
| 2021 | $4,738 | $152,700 | $0 | $0 |
| 2020 | $3,529 | $145,300 | $0 | $0 |
| 2019 | $367,944 | $139,000 | $0 | $0 |
| 2018 | $4,536 | $136,600 | $0 | $0 |
| 2017 | $4,360 | $130,000 | $0 | $0 |
| 2016 | $4,053 | $118,200 | $0 | $0 |
| 2015 | $3,968 | $118,200 | $0 | $0 |
| 2013 | -- | $109,500 | $0 | $0 |
Source: Public Records
Map
Nearby Homes
- 6093 E Alanada Ct SE
- 5631 SE Pioneer Pass
- 8475 Deer Forest Meadows Dr SE
- 5655 Pioneer Pass SE
- 6701 Green Valley Ct SE
- 8410 N Jasonville Ct SE Unit 71
- 5964 Valley Point Dr SE
- 5926 Valley Point Dr SE
- 5850 Valley Point Dr SE
- 5961 Valley Point Dr SE
- 8572 Bosque Dr
- 6629 Jousma Ct SE
- 141 Mill St SE
- 8548 Bosque Dr
- 8503 Bosque Dr SE
- 8497 Green Valley Rd SE
- 520 E Main St SE
- 8201 Cherry Valley Ave SE
- 8626 Rainbows End Rd SE
- 5480 84th St SE
- 8890 Alanada Dr SE
- 8831 Costner Dr SE
- 8768 Costner Dr SE
- 9183 Costner Dr SE
- 8900 Alanada Dr SE
- 8871 Costner Dr SE
- 8758 Costner Dr SE
- 8877 Alanada Dr SE
- 8778 Costner Dr SE
- 8885 Alanada Dr SE
- 8814 Costner Dr SE
- 8871 Alanada Dr SE
- 8850 Costner Dr SE
- 8891 Alanada Dr SE
- 8919 Costner Dr SE
- 6111 E Alanada Ct SE
- 8886 Costner Dr SE
- 8899 Alanada Dr SE
- 6135 N Costner Ct SE
- 8922 Costner Dr SE