8791 Garbini St Gilroy, CA 95020
Las Animas NeighborhoodEstimated Value: $884,000 - $942,341
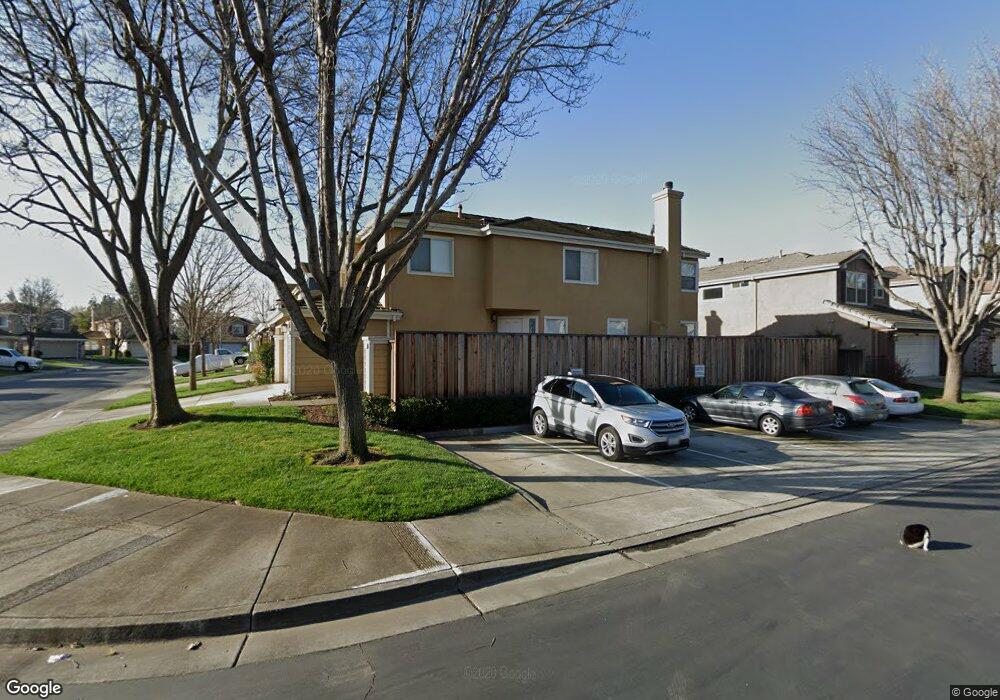
About This Home
This home is located at 8791 Garbini St, Gilroy, CA 95020 and is currently estimated at $901,335, approximately $496 per square foot. 8791 Garbini St is a home located in Santa Clara County with nearby schools including South Valley Middle School, Solorsano Middle School, and Christopher High School.
Ownership History
We collect this data history from publicly available records. To have your information removed, we recommend requesting removal directly through your county’s website.
Purchase Details
Home Financials for this Owner
Home Financials are based on the most recent Mortgage that was taken out on this home.Purchase Details
Home Financials for this Owner
Home Financials are based on the most recent Mortgage that was taken out on this home.Purchase Details
Home Financials for this Owner
Home Financials are based on the most recent Mortgage that was taken out on this home.Home Values in the Area
Average Home Value in this Area
Purchase History
We collect this data history from publicly available records. To have your information removed, we recommend requesting removal directly through your county’s website.
| Date | Buyer | Sale Price | Title Company |
|---|---|---|---|
| $488,500 | Financial Title Company | ||
| $399,000 | First American Title Co | ||
| $217,000 | First American Title Guarant |
Mortgage History
We collect this data history from publicly available records. To have your information removed, we recommend requesting removal directly through your county’s website.
| Date | Status | Borrower | Loan Amount |
|---|---|---|---|
| Open | $390,800 | ||
| Previous Owner | $379,050 | ||
| Previous Owner | $180,000 | ||
| Closed | $97,700 |
Tax History
We collect this data history from publicly available records. To have your information removed, we recommend requesting removal directly through your county’s website.
| Year | Tax Paid | Tax Assessment Tax Assessment Total Assessment is a certain percentage of the fair market value that is determined by local assessors to be the total taxable value of land and additions on the property. | Land | Improvement |
|---|---|---|---|---|
| 2025 | $8,384 | $694,526 | $242,975 | $451,551 |
| 2024 | $8,384 | $680,909 | $238,211 | $442,698 |
| 2023 | $8,334 | $667,559 | $233,541 | $434,018 |
| 2022 | $8,196 | $654,470 | $228,962 | $425,508 |
| 2021 | $8,158 | $641,638 | $224,473 | $417,165 |
| 2020 | $8,068 | $635,060 | $222,172 | $412,888 |
| 2019 | $7,991 | $622,609 | $217,816 | $404,793 |
| 2018 | $7,460 | $610,402 | $213,546 | $396,856 |
| 2017 | $7,616 | $598,434 | $209,359 | $389,075 |
| 2016 | $7,463 | $586,701 | $205,254 | $381,447 |
| 2015 | $6,069 | $498,000 | $174,200 | $323,800 |
| 2014 | $5,239 | $424,000 | $148,300 | $275,700 |
Map
- 500 Ronan Ave
- 500 Birdsong St
- 119 Farrell Ave
- 103 Farrell Ave
- 111 Farrell Ave
- 833 Welburn Ave
- 690 El Cerrito Way
- 118 Chickadee Ln
- 887 Martiri Dr
- 154 Sandpiper Way
- 920 Casciano Cir
- 1050 Violet Way
- 283 Windsong Way
- 150 Harrier Place
- 626 Broadway
- 0000 Hecker Pass
- 620 Broadway
- 622 Broadway
- 8312 Kelton Dr
- 7934 Kipling Cir
Ask me questions while you tour the home.