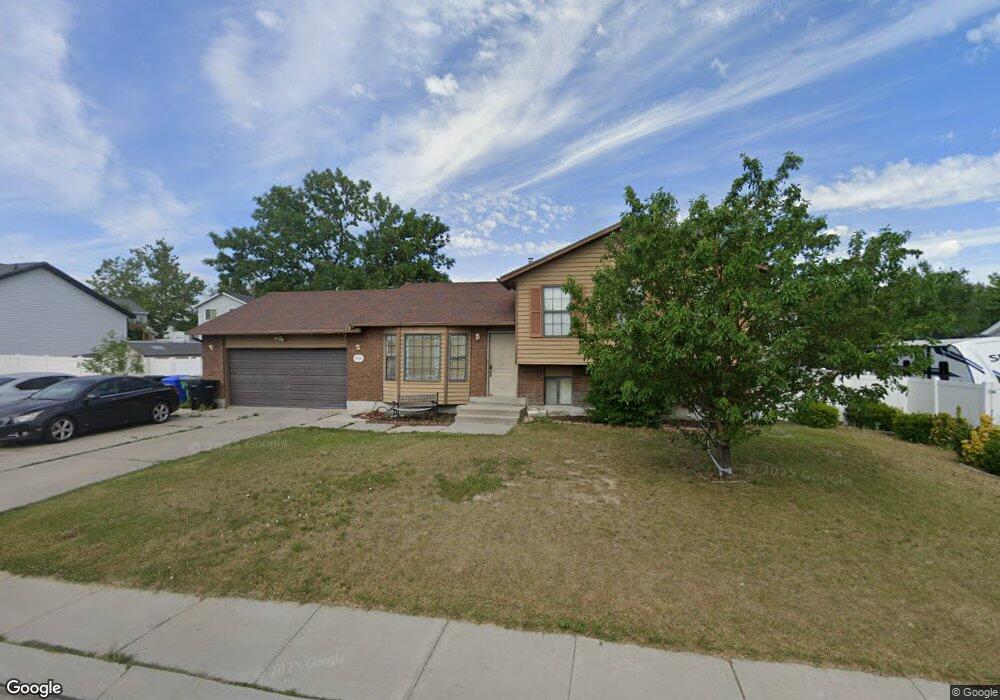
8794 S 3680 W West Jordan, UT 84088
Jordan Oaks NeighborhoodEstimated Value: $492,000 - $598,000
4
Beds
3
Baths
2,130
Sq Ft
$252/Sq Ft
Est. Value
About This Home
This home is located at 8794 S 3680 W, West Jordan, UT 84088 and is currently estimated at $537,012, approximately $252 per square foot. 8794 S 3680 W is a home located in Salt Lake County with nearby schools including Terra Linda Elementary School, Joel P. Jensen Middle School, and West Jordan High School.
Ownership History
Date
Name
Owned For
Owner Type
Purchase Details
Closed on
May 19, 2004
Sold by
Forsman Melvin Darcy
Bought by
Sy Sang
Current Estimated Value
Home Financials for this Owner
Home Financials are based on the most recent Mortgage that was taken out on this home.
Original Mortgage
$161,405
Outstanding Balance
$77,111
Interest Rate
5.77%
Mortgage Type
Unknown
Estimated Equity
$459,901
Purchase Details
Closed on
Mar 17, 2004
Sold by
Bank Of New York
Bought by
Forsman Melvin Darcy
Purchase Details
Closed on
Feb 10, 2004
Sold by
Ahlstrom Anjanette
Bought by
Bank Of New York and Cwabs #101-Bc2
Purchase Details
Closed on
Jan 18, 2001
Sold by
Mcpartland Thomas Raymond and Mcpartland Pearl Marie
Bought by
Ahlstrom Anjanette
Home Financials for this Owner
Home Financials are based on the most recent Mortgage that was taken out on this home.
Original Mortgage
$122,400
Interest Rate
10.5%
Create a Home Valuation Report for This Property
The Home Valuation Report is an in-depth analysis detailing your home's value as well as a comparison with similar homes in the area
Home Values in the Area
Average Home Value in this Area
Purchase History
| Date | Buyer | Sale Price | Title Company |
|---|---|---|---|
| Sy Sang | -- | Bonneville Title Co | |
| Forsman Melvin Darcy | -- | First American Title | |
| Bank Of New York | $108,636 | United Title Services | |
| Ahlstrom Anjanette | -- | America West Title |
Source: Public Records
Mortgage History
| Date | Status | Borrower | Loan Amount |
|---|---|---|---|
| Open | Sy Sang | $161,405 | |
| Previous Owner | Ahlstrom Anjanette | $122,400 | |
| Closed | Ahlstrom Anjanette | $30,600 |
Source: Public Records
Tax History Compared to Growth
Tax History
| Year | Tax Paid | Tax Assessment Tax Assessment Total Assessment is a certain percentage of the fair market value that is determined by local assessors to be the total taxable value of land and additions on the property. | Land | Improvement |
|---|---|---|---|---|
| 2025 | -- | $493,800 | $146,200 | $347,600 |
| 2024 | -- | $491,200 | $144,700 | $346,500 |
| 2023 | $2,515 | $456,100 | $141,800 | $314,300 |
| 2022 | $2,604 | $464,500 | $139,100 | $325,400 |
| 2021 | $2,860 | $356,400 | $95,900 | $260,500 |
| 2020 | $1,841 | $280,600 | $78,600 | $202,000 |
| 2019 | $1,847 | $276,000 | $78,600 | $197,400 |
| 2018 | $0 | $254,400 | $76,500 | $177,900 |
| 2017 | $1,607 | $237,200 | $76,500 | $160,700 |
| 2016 | $1,565 | $217,000 | $76,500 | $140,500 |
| 2015 | $1,592 | $215,200 | $78,000 | $137,200 |
| 2014 | $1,528 | $203,400 | $74,300 | $129,100 |
Source: Public Records
Map
Nearby Homes
- 3888 W 8700 S
- 3931 W Dansere Cir
- 8983 S 3860 W
- 8461 S Meadowlark Ln
- 8400 S 4000 W Unit 134
- 3750 W Bingham Creek Dr
- 3214 W Monterey Pine Ln
- 8493 S 3200 W
- 3702 W Angus Dr
- 8941 S Sun Leaf Dr
- 3977 W Elwood Way
- 2990 W 8870 S
- 9441 S Newkirk St
- 8180 S Old Bingham Hwy
- 9375 S Laurel Ridge Cir
- 2970 W 8870 S
- 3112 Green Acre Dr
- 9526 Ember Glow Ct Unit C
- 7991 S 3725 W
- 8407 Meadow Green Way
- 8810 S 3680 W
- 8797 S 3715 W
- 8780 S 3680 W
- 8785 S 3715 W
- 8811 S 3715 W
- 8793 S 3680 W
- 8781 S 3680 W
- 8807 S 3680 W
- 8828 S 3680 W
- 3667 Valley West Dr
- 3667 W Valleywest Dr
- 3667 W Valleywest Dr
- 8819 S 3680 W
- 3727 W Valleywest Dr
- 8792 S 3645 W
- 3727 Valley West Dr
- 3696 Valley West Dr
- 3727 W Valleywest Dr
- 3708 Valley West Dr
- 8808 S 3645 W