8796 Duncn Barel Ave Unit 102 Las Vegas, NV 89178
Mountains Edge NeighborhoodEstimated Value: $297,000 - $304,000
2
Beds
3
Baths
1,167
Sq Ft
$258/Sq Ft
Est. Value
About This Home
This home is located at 8796 Duncn Barel Ave Unit 102, Las Vegas, NV 89178 and is currently estimated at $301,305, approximately $258 per square foot. 8796 Duncn Barel Ave Unit 102 is a home located in Clark County with nearby schools including William V. Wright Elementary School, Desert Oasis High School, and Doral Academy Cactus.
Ownership History
Date
Name
Owned For
Owner Type
Purchase Details
Closed on
Mar 25, 2011
Sold by
Bagdasarian Peter and Adamyan Marina
Bought by
Moro Property Investment Llc
Current Estimated Value
Purchase Details
Closed on
Feb 4, 2011
Sold by
Clawson Jill
Bought by
Bagdasarian Peter and Adamyan Marina
Purchase Details
Closed on
Mar 15, 2005
Sold by
Jones James
Bought by
Clawson Jill
Home Financials for this Owner
Home Financials are based on the most recent Mortgage that was taken out on this home.
Original Mortgage
$172,000
Interest Rate
6.12%
Mortgage Type
Stand Alone First
Purchase Details
Closed on
Oct 28, 2004
Sold by
Dr Horton Inc
Bought by
Jones James
Home Financials for this Owner
Home Financials are based on the most recent Mortgage that was taken out on this home.
Original Mortgage
$147,348
Interest Rate
6.25%
Mortgage Type
Unknown
Create a Home Valuation Report for This Property
The Home Valuation Report is an in-depth analysis detailing your home's value as well as a comparison with similar homes in the area
Home Values in the Area
Average Home Value in this Area
Purchase History
| Date | Buyer | Sale Price | Title Company |
|---|---|---|---|
| Moro Property Investment Llc | $70,000 | None Available | |
| Bagdasarian Peter | $70,000 | Lawyers Title Of Nevada Hen | |
| Clawson Jill | $215,000 | Chicago Title | |
| Jones James | $163,720 | Chicago Title |
Source: Public Records
Mortgage History
| Date | Status | Borrower | Loan Amount |
|---|---|---|---|
| Previous Owner | Clawson Jill | $172,000 | |
| Previous Owner | Jones James | $147,348 | |
| Closed | Clawson Jill | $43,000 |
Source: Public Records
Tax History Compared to Growth
Tax History
| Year | Tax Paid | Tax Assessment Tax Assessment Total Assessment is a certain percentage of the fair market value that is determined by local assessors to be the total taxable value of land and additions on the property. | Land | Improvement |
|---|---|---|---|---|
| 2025 | $1,187 | $72,822 | $28,000 | $44,822 |
| 2024 | $1,100 | $72,822 | $28,000 | $44,822 |
| 2023 | $1,100 | $64,882 | $24,500 | $40,382 |
| 2022 | $1,019 | $59,366 | $21,000 | $38,366 |
| 2021 | $943 | $49,525 | $18,550 | $30,975 |
| 2020 | $873 | $50,942 | $18,550 | $32,392 |
| 2019 | $818 | $49,614 | $17,500 | $32,114 |
| 2018 | $781 | $41,818 | $11,200 | $30,618 |
| 2017 | $1,184 | $40,316 | $9,800 | $30,516 |
| 2016 | $732 | $37,776 | $7,700 | $30,076 |
| 2015 | $730 | $29,549 | $5,950 | $23,599 |
| 2014 | $707 | $24,439 | $3,500 | $20,939 |
Source: Public Records
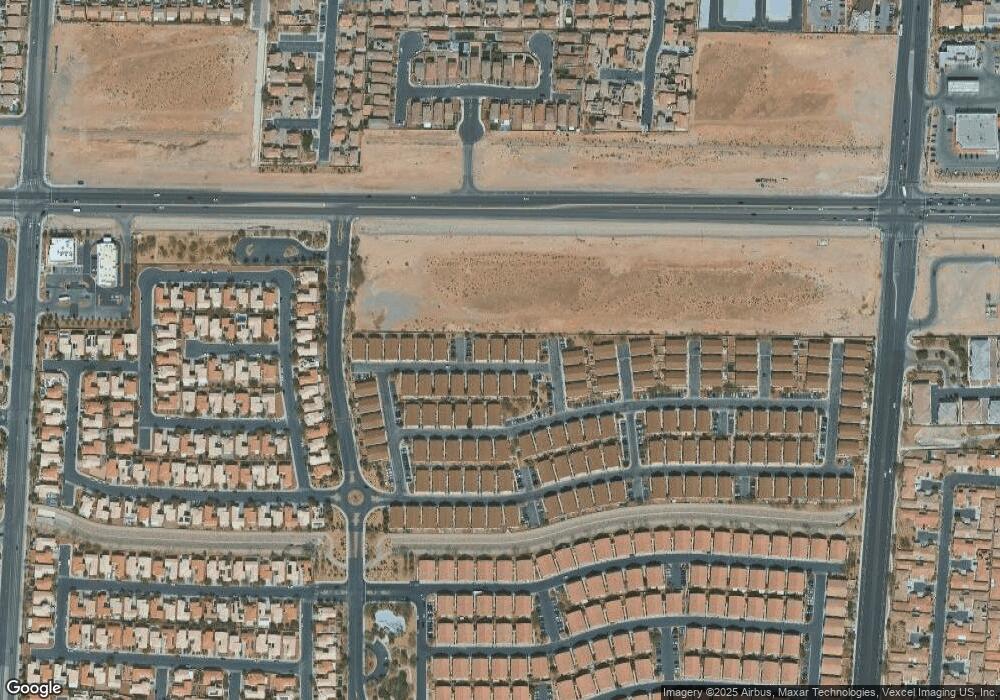
Map
Nearby Homes
- 8808 Roping Rodeo Ave Unit 103
- 8823 Roping Rodeo Ave Unit 101
- 8842 Duncan Barrel Ave Unit 101
- 8866 Duncan Barrel Ave Unit 102
- 8811 Tomnitz Ave Unit 101
- 9338 Square Dance Place Unit 101
- 8843 Tomnitz Ave Unit 102
- 8707 Roping Rodeo Ave Unit 102
- 8798 Tom Noon Ave Unit 103
- 8768 Tom Noon Ave Unit 101
- 8748 Tom Noon Ave Unit 101
- 8688 Tomnitz Ave Unit 101
- 8645 Tomnitz Ave Unit 102
- 8658 Tom Noon Ave Unit 103
- 9340 Lakefront Color St
- 8689 Horizon Wind Ave Unit 103
- 9466 Marshall Creek St
- 8638 Tom Noon Ave Unit 102
- 9322 Straw Hays St Unit 103
- 8664 Traveling Breeze Ave Unit 102
- 8796 Duncn Barel Ave Unit 101
- 8796 Duncn Barel Ave Unit 103
- 8796 Duncan Barrel Ave Unit 103
- 8796 Duncan Barrel Ave Unit 101
- 8796 Duncan Barrel Ave Unit 102
- 8806 Duncan Barrel Ave
- 8806 Duncan Barrel Ave Unit 103
- 8806 Duncan Barrel Ave Unit 101
- 8806 Duncan Barrel Ave Unit 102
- 8806 Duncn Barel Ave Unit 102
- 8806 Duncn Barel Ave Unit 101
- 8806 Duncn Barel Ave Unit 103
- 8786 Duncan Barrel Ave Unit 102
- 8786 Duncan Barrel Ave Unit 101
- 8786 Duncan Barrel Ave Unit 103
- 8786 Duncn Barel Ave Unit 101
- 8786 Duncn Barel Ave Unit 103
- 8786 Duncn Barel Ave Unit 102
- 8801 Duncn Barel Ave Unit 103
- 8801 Duncn Barel Ave Unit 101