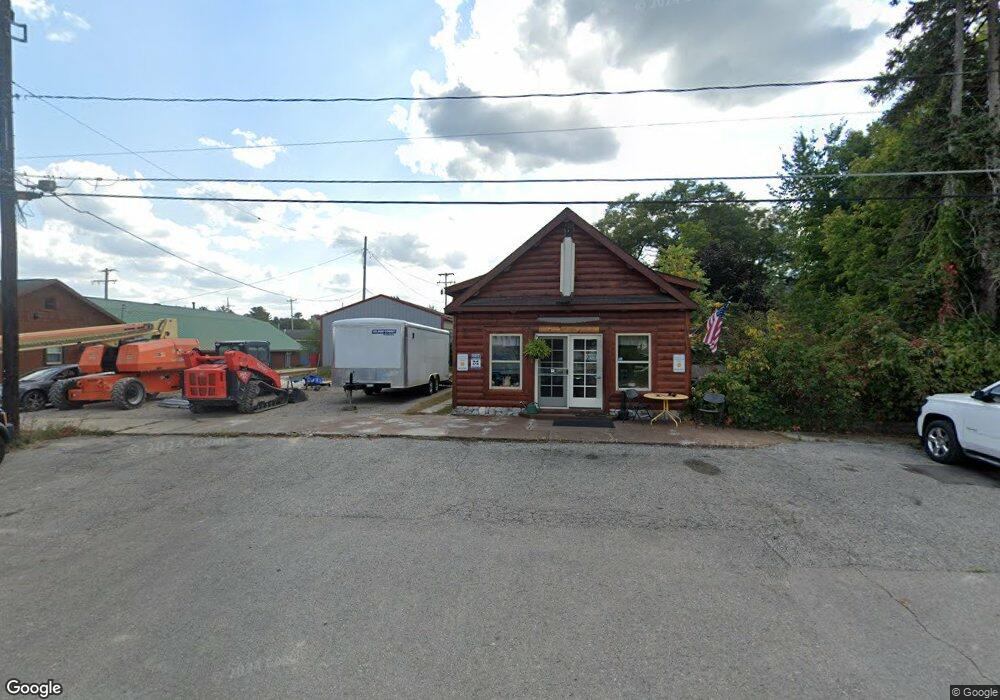
8798 W M 68 Hwy Indian River, MI 49749
Estimated Value: $418,000 - $2,645,542
--
Bed
--
Bath
--
Sq Ft
2.2
Acres
About This Home
This home is located at 8798 W M 68 Hwy, Indian River, MI 49749 and is currently estimated at $1,531,771. 8798 W M 68 Hwy is a home located in Cheboygan County with nearby schools including Inland Lakes Elementary School, Inland Lakes Secondary School, and Northern Michigan Christ Academy.
Ownership History
Date
Name
Owned For
Owner Type
Purchase Details
Closed on
Aug 30, 2023
Sold by
Powers Jeffrey F
Bought by
Powers Jeffrey F Trust
Current Estimated Value
Purchase Details
Closed on
Nov 13, 2020
Sold by
Yosheff Paul
Bought by
Powers Jeffrey F
Home Financials for this Owner
Home Financials are based on the most recent Mortgage that was taken out on this home.
Original Mortgage
$1,500,000
Interest Rate
2.8%
Mortgage Type
New Conventional
Purchase Details
Closed on
Sep 26, 2019
Sold by
Yosheff Paul
Bought by
Yosheff Paul And Luba Trust
Purchase Details
Closed on
Jul 1, 2014
Bought by
Yosheff Paul and Yosheff Luba
Purchase Details
Closed on
Aug 20, 1997
Sold by
Beaton Mark
Bought by
Anthony Paul and Mary Lee
Purchase Details
Closed on
Apr 10, 1996
Sold by
Wilkins Leonard
Bought by
Beaton Mark and Beaton Alison
Purchase Details
Closed on
Jun 1, 1995
Sold by
Stewart Ervin Ernest
Bought by
Wilkins Leonard and Wilkins Donna
Create a Home Valuation Report for This Property
The Home Valuation Report is an in-depth analysis detailing your home's value as well as a comparison with similar homes in the area
Home Values in the Area
Average Home Value in this Area
Purchase History
| Date | Buyer | Sale Price | Title Company |
|---|---|---|---|
| Powers Jeffrey F Trust | -- | -- | |
| Powers Jeffrey F | -- | -- | |
| Yosheff Paul And Luba Trust | -- | -- | |
| Yosheff Paul | -- | -- | |
| Anthony Paul | $213,000 | -- | |
| Beaton Mark | $175,000 | -- | |
| Wilkins Leonard | $135,000 | -- |
Source: Public Records
Mortgage History
| Date | Status | Borrower | Loan Amount |
|---|---|---|---|
| Previous Owner | Powers Jeffrey F | $1,500,000 |
Source: Public Records
Tax History Compared to Growth
Tax History
| Year | Tax Paid | Tax Assessment Tax Assessment Total Assessment is a certain percentage of the fair market value that is determined by local assessors to be the total taxable value of land and additions on the property. | Land | Improvement |
|---|---|---|---|---|
| 2025 | $13,534 | $1,245,300 | $0 | $0 |
| 2024 | $6,214 | $1,017,200 | $0 | $0 |
| 2023 | $5,956 | $975,100 | $0 | $0 |
| 2022 | $5,672 | $757,400 | $0 | $0 |
| 2021 | $20,557 | $465,800 | $465,800 | $0 |
| 2020 | $10,166 | $428,800 | $428,800 | $0 |
| 2019 | $10,063 | $406,500 | $406,500 | $0 |
| 2018 | $9,702 | $430,000 | $0 | $0 |
| 2017 | $9,323 | $416,600 | $0 | $0 |
| 2016 | $9,229 | $440,400 | $0 | $0 |
| 2015 | -- | $427,100 | $0 | $0 |
| 2014 | -- | $393,000 | $0 | $0 |
| 2012 | -- | $370,700 | $0 | $0 |
Source: Public Records
Map
Nearby Homes
- 8554 W M-68 Hwy
- 8601 Michigan 68
- 9734 W M-68 Hwy
- 4732 S Straits Hwy
- 6780 Grace St
- 5115 S Straits Hwy
- 7215 Tuscarora Cir
- 6574 Burchfield Rd
- 6647 Barbara Ave
- 3687 Pier Ave
- 6378 Hillside Ave
- 6415 Pike St
- 6363 Burchfield Rd
- 5064 Wilson Rd
- 10398 W M-68 Hwy
- 4245/4237 Rainbow End Trail
- 4229 Rainbow End Trail
- 1998 Resort Rd
- 6986 Chippewa Trail
- 3739 Club Rd
- 8798 Michigan 68
- 8760 W M 68 Hwy
- 8760 W M-68 Hwy
- 8760 W M 68 Hwy
- 8926 W M 68 Hwy
- 8926 W M 68 Hwy
- 8926 Michigan 68
- 8798 Michigan 68
- 8854 W M 68 Hwy
- 8690 W M 68 Hwy
- 8760 Michigan 68
- 8620 Michigan 68
- 8720 Michigan 68
- 8600 W M 68 Hwy
- 0 W M-68 Hwy Unit 294901
- 0 W M-68 Hwy Unit 2.5 acres+- 295779
- 0 W M-68 Hwy Unit 2 Acres 276482
- 0 W M-68 Hwy Unit 314038
- 0 W M-68 Hwy Unit Parcel A 306685
- 0 W M-68 Hwy Unit Com N 1/4 Corner of