8799 N 387 Rd Locust Grove, OK 74352
Estimated Value: $428,000 - $2,498,000
4
Beds
3
Baths
2,935
Sq Ft
$391/Sq Ft
Est. Value
About This Home
This home is located at 8799 N 387 Rd, Locust Grove, OK 74352 and is currently estimated at $1,146,333, approximately $390 per square foot. 8799 N 387 Rd is a home located in Cherokee County with nearby schools including Locust Grove Early Lrning Center, Locust Grove Upper Elementary School, and Locust Grove Middle School.
Ownership History
Date
Name
Owned For
Owner Type
Purchase Details
Closed on
May 1, 2023
Sold by
Pudewa Andrew L and Pudewa Robin G
Bought by
Duffy Joseph P and Duffy Jennifer L
Current Estimated Value
Purchase Details
Closed on
Aug 18, 2021
Sold by
Dursi Judith Anne and The Judith Anne Dursi Family T
Bought by
Duffy Joseph P and Duffy Jennifer L
Home Financials for this Owner
Home Financials are based on the most recent Mortgage that was taken out on this home.
Original Mortgage
$240,000
Interest Rate
2.8%
Mortgage Type
New Conventional
Purchase Details
Closed on
Jun 12, 2020
Sold by
Pudewa Andrew L and Pudewa Robin G
Bought by
Dursi Judith Anne and The Judith Anne Dursi Family Trust
Purchase Details
Closed on
Dec 12, 2008
Sold by
Lawless Michael W and Lawless Kathryn M
Bought by
Pudewa Andrew L and Pudewa Robin G
Create a Home Valuation Report for This Property
The Home Valuation Report is an in-depth analysis detailing your home's value as well as a comparison with similar homes in the area
Home Values in the Area
Average Home Value in this Area
Purchase History
| Date | Buyer | Sale Price | Title Company |
|---|---|---|---|
| Duffy Joseph P | $36,500 | Fidelity National Title | |
| Duffy Joseph P | $413,500 | American Abstract & Title Co | |
| Dursi Judith Anne | $317,000 | Firstitle & Abstract Svcs Ll | |
| Pudewa Andrew L | $120,000 | Cherokee Capitol Closing Se |
Source: Public Records
Mortgage History
| Date | Status | Borrower | Loan Amount |
|---|---|---|---|
| Previous Owner | Duffy Joseph P | $240,000 |
Source: Public Records
Tax History Compared to Growth
Tax History
| Year | Tax Paid | Tax Assessment Tax Assessment Total Assessment is a certain percentage of the fair market value that is determined by local assessors to be the total taxable value of land and additions on the property. | Land | Improvement |
|---|---|---|---|---|
| 2024 | $4,442 | $46,943 | $4,400 | $42,543 |
| 2023 | $4,442 | $45,577 | $4,400 | $41,177 |
| 2022 | $4,271 | $45,485 | $2,810 | $42,675 |
| 2021 | $3,341 | $34,870 | $2,810 | $32,060 |
| 2020 | $2,280 | $23,460 | $106 | $23,354 |
| 2019 | $2,466 | $25,347 | $1,011 | $24,336 |
| 2018 | $2,492 | $25,127 | $1,003 | $24,124 |
| 2017 | $2,421 | $24,396 | $837 | $23,559 |
| 2016 | $2,297 | $23,685 | $714 | $22,971 |
| 2015 | $2,248 | $22,995 | $888 | $22,107 |
| 2014 | $2,321 | $23,931 | $888 | $23,043 |
Source: Public Records
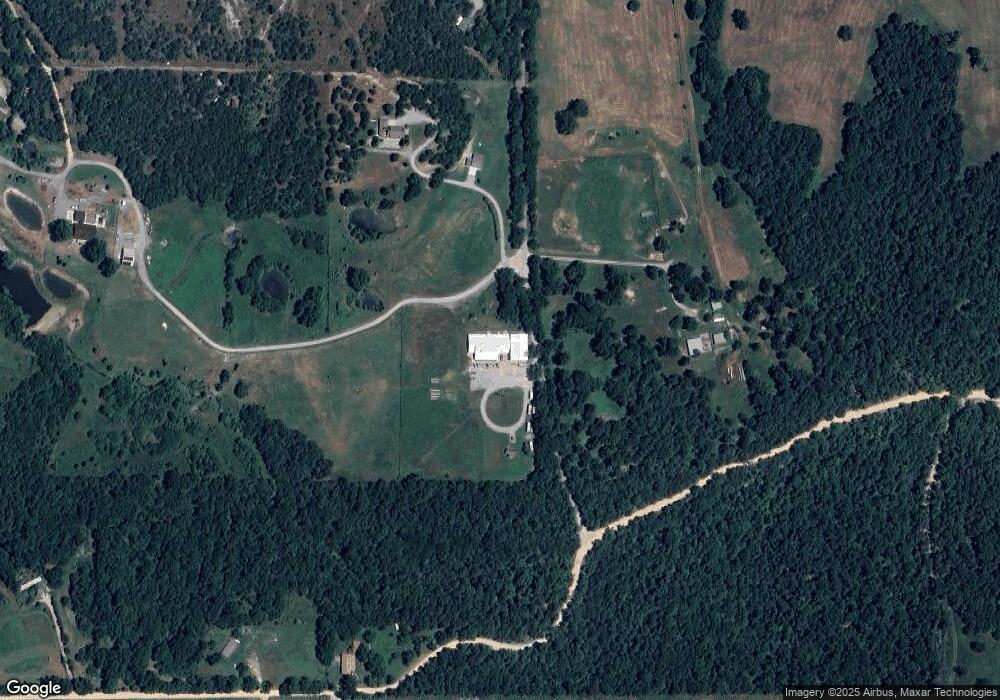
Map
Nearby Homes
- 8465 W 660 Rd
- 8465 W 660 Rd Hulbert Unit OK 74441
- 14209 S 439
- 0 Rural Route Unit 25-1842
- 0 Rural Route Unit 2536190
- 0 W 710 Rd Unit 2438380
- 0 W 710 Rd Unit 2438372
- 0 W 710 Rd Unit 2438367
- 15 W 691 Rd
- 10223 W 670 Rd
- 34190 E 651 Way
- 8683 N 436 Rd
- 13017 N Quail Ave
- 13235 Red Bud Dr
- 0 650 Rd E Unit 25-1213
- Lake Crest
- Lake Crest
- E E 651 Rd
- S S 337 Rd
- 33684 E 650 Dr