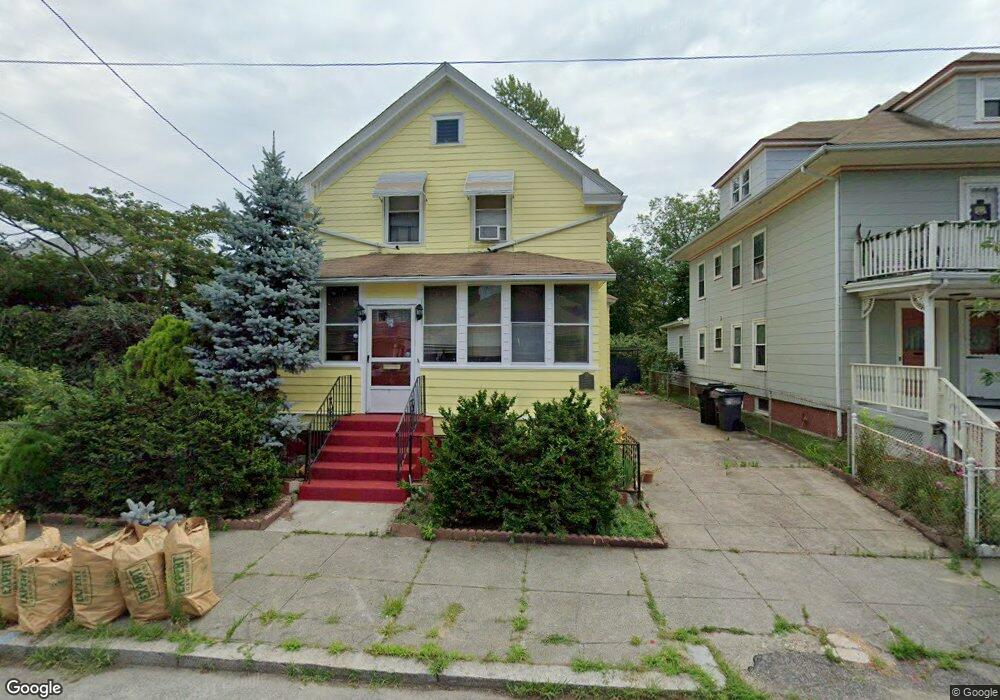
88 Alger Ave Providence, RI 02907
South Elmwood NeighborhoodEstimated Value: $295,000 - $409,000
3
Beds
2
Baths
1,305
Sq Ft
$271/Sq Ft
Est. Value
About This Home
This home is located at 88 Alger Ave, Providence, RI 02907 and is currently estimated at $353,751, approximately $271 per square foot. 88 Alger Ave is a home located in Providence County with nearby schools including Asa Messer Elementary School, Charles N. Fortes Elementary School, and Alfred Lima Sr. Elementary School.
Ownership History
Date
Name
Owned For
Owner Type
Purchase Details
Closed on
Dec 10, 2021
Sold by
Cindy Rivera Invs Llc
Bought by
Rivera Cindy M
Current Estimated Value
Home Financials for this Owner
Home Financials are based on the most recent Mortgage that was taken out on this home.
Original Mortgage
$164,020
Outstanding Balance
$150,643
Interest Rate
2.98%
Mortgage Type
New Conventional
Estimated Equity
$203,108
Purchase Details
Closed on
Jan 14, 2021
Sold by
Mitchell Elizabeth
Bought by
Cindy Riva Invs Llc
Home Financials for this Owner
Home Financials are based on the most recent Mortgage that was taken out on this home.
Original Mortgage
$150,000
Interest Rate
2.71%
Mortgage Type
Purchase Money Mortgage
Purchase Details
Closed on
Nov 30, 2015
Sold by
Laliberte Alma M
Bought by
Mitchell Elizabeth
Create a Home Valuation Report for This Property
The Home Valuation Report is an in-depth analysis detailing your home's value as well as a comparison with similar homes in the area
Home Values in the Area
Average Home Value in this Area
Purchase History
| Date | Buyer | Sale Price | Title Company |
|---|---|---|---|
| Rivera Cindy M | -- | None Available | |
| Cindy Riva Invs Llc | $170,000 | None Available | |
| Mitchell Elizabeth | -- | -- |
Source: Public Records
Mortgage History
| Date | Status | Borrower | Loan Amount |
|---|---|---|---|
| Open | Rivera Cindy M | $164,020 | |
| Previous Owner | Cindy Riva Invs Llc | $150,000 |
Source: Public Records
Tax History Compared to Growth
Tax History
| Year | Tax Paid | Tax Assessment Tax Assessment Total Assessment is a certain percentage of the fair market value that is determined by local assessors to be the total taxable value of land and additions on the property. | Land | Improvement |
|---|---|---|---|---|
| 2025 | $2,890 | $344,100 | $128,000 | $216,100 |
| 2024 | $4,674 | $254,700 | $86,000 | $168,700 |
| 2023 | $4,674 | $254,700 | $86,000 | $168,700 |
| 2022 | $4,534 | $254,700 | $86,000 | $168,700 |
| 2021 | $4,065 | $165,500 | $54,900 | $110,600 |
| 2020 | $4,065 | $165,500 | $54,900 | $110,600 |
| 2019 | $4,065 | $165,500 | $54,900 | $110,600 |
| 2018 | $4,120 | $128,900 | $49,900 | $79,000 |
| 2017 | $4,120 | $128,900 | $49,900 | $79,000 |
| 2016 | $4,120 | $128,900 | $49,900 | $79,000 |
| 2015 | $3,691 | $111,500 | $38,800 | $72,700 |
| 2014 | $3,763 | $111,500 | $38,800 | $72,700 |
| 2013 | $3,763 | $111,500 | $38,800 | $72,700 |
Source: Public Records
Map
Nearby Homes