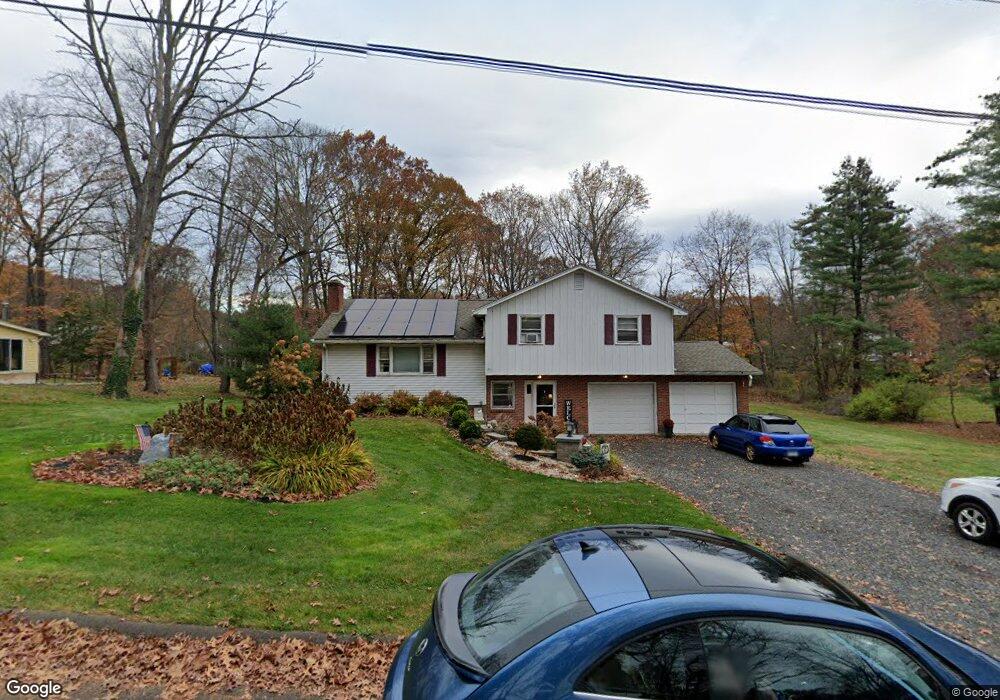
88 Ash Rd South Windsor, CT 06074
Estimated Value: $400,000 - $457,000
3
Beds
2
Baths
1,428
Sq Ft
$302/Sq Ft
Est. Value
About This Home
This home is located at 88 Ash Rd, South Windsor, CT 06074 and is currently estimated at $430,592, approximately $301 per square foot. 88 Ash Rd is a home located in Hartford County with nearby schools including Timothy Edwards School and South Windsor High School.
Ownership History
Date
Name
Owned For
Owner Type
Purchase Details
Closed on
Feb 14, 2013
Sold by
Skehan Matthew E and Metclaf Holli L
Bought by
Skehan Matthew E and Metclaf Holli L
Current Estimated Value
Home Financials for this Owner
Home Financials are based on the most recent Mortgage that was taken out on this home.
Original Mortgage
$192,816
Outstanding Balance
$134,065
Interest Rate
3.37%
Mortgage Type
FHA
Estimated Equity
$296,527
Purchase Details
Closed on
Aug 24, 2009
Sold by
Household Rlty
Bought by
Skehan Matthew and Metcall Molli
Home Financials for this Owner
Home Financials are based on the most recent Mortgage that was taken out on this home.
Original Mortgage
$196,278
Interest Rate
5.19%
Purchase Details
Closed on
Apr 13, 2009
Sold by
Elliott Mark
Bought by
Household Realty Corp
Purchase Details
Closed on
Apr 1, 1987
Sold by
Wittig Malcolm
Bought by
Elliott Mark
Create a Home Valuation Report for This Property
The Home Valuation Report is an in-depth analysis detailing your home's value as well as a comparison with similar homes in the area
Home Values in the Area
Average Home Value in this Area
Purchase History
| Date | Buyer | Sale Price | Title Company |
|---|---|---|---|
| Skehan Matthew E | -- | -- | |
| Skehan Matthew | $199,900 | -- | |
| Household Realty Corp | -- | -- | |
| Elliott Mark | $109,500 | -- |
Source: Public Records
Mortgage History
| Date | Status | Borrower | Loan Amount |
|---|---|---|---|
| Open | Skehan Matthew E | $192,816 | |
| Previous Owner | Elliott Mark | $196,278 | |
| Previous Owner | Elliott Mark | $32,420 | |
| Previous Owner | Elliott Mark | $253,088 |
Source: Public Records
Tax History Compared to Growth
Tax History
| Year | Tax Paid | Tax Assessment Tax Assessment Total Assessment is a certain percentage of the fair market value that is determined by local assessors to be the total taxable value of land and additions on the property. | Land | Improvement |
|---|---|---|---|---|
| 2025 | $8,297 | $233,000 | $107,300 | $125,700 |
| 2024 | $8,005 | $232,300 | $107,300 | $125,000 |
| 2023 | $7,698 | $232,300 | $107,300 | $125,000 |
| 2022 | $7,126 | $183,800 | $100,500 | $83,300 |
| 2021 | $6,959 | $183,800 | $100,500 | $83,300 |
| 2020 | $6,962 | $183,800 | $100,500 | $83,300 |
| 2019 | $7,076 | $183,800 | $100,500 | $83,300 |
| 2018 | $6,924 | $183,800 | $100,500 | $83,300 |
| 2017 | $6,557 | $172,200 | $100,500 | $71,700 |
| 2016 | $6,430 | $172,200 | $100,500 | $71,700 |
| 2015 | $6,292 | $172,200 | $100,500 | $71,700 |
| 2014 | $6,115 | $172,200 | $100,500 | $71,700 |
Source: Public Records
Map
Nearby Homes
- 88 Andreis Trail
- 59 Saginaw St
- 51 Carriage Dr
- 835 Foster Street Extension
- 2560 Ellington Rd
- 50 High St
- 11 Kupchunos Rd
- 2719 Ellington Rd
- 2773 Ellington Rd
- 816 Sand Stone Dr Unit 816
- 178 Beelzebub Rd
- 178 Scott Dr
- 387 Foster St
- 360 Felt Rd
- 68 Kent Ln
- 668 Sullivan Ave
- 66 Farmbrook Ln
- 76 Griffin Rd
- 31 Wendy Dr
- 10 Victorian Woods Ln Unit 10