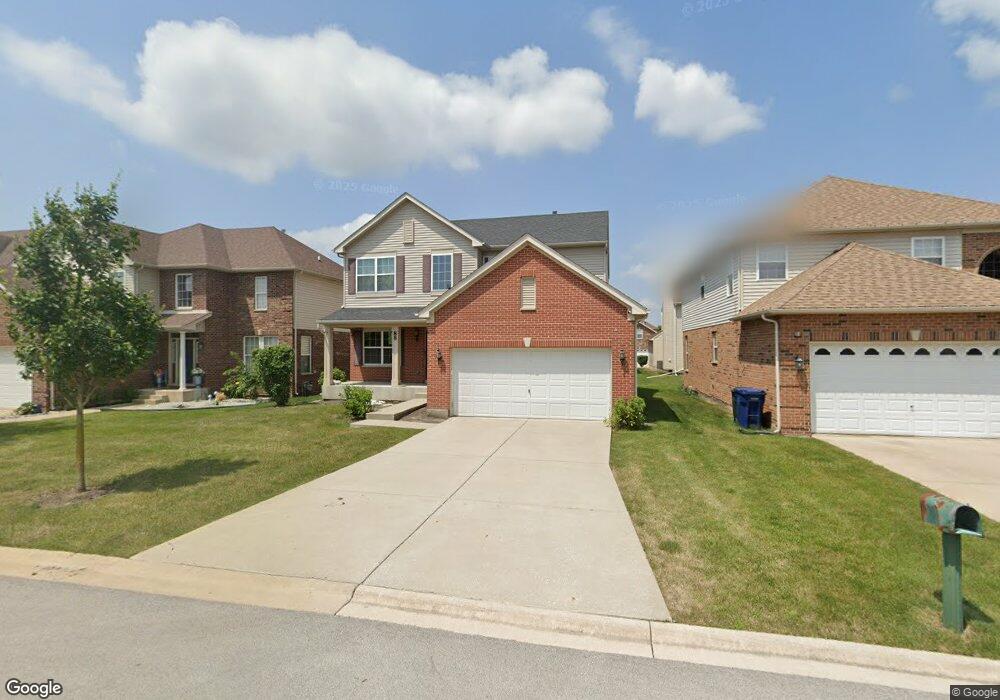
88 Bowman St Matteson, IL 60443
Old Matteson NeighborhoodEstimated Value: $314,000 - $381,000
5
Beds
3
Baths
3,273
Sq Ft
$109/Sq Ft
Est. Value
About This Home
This home is located at 88 Bowman St, Matteson, IL 60443 and is currently estimated at $358,357, approximately $109 per square foot. 88 Bowman St is a home located in Cook County with nearby schools including Colin Powell Middle School.
Ownership History
Date
Name
Owned For
Owner Type
Purchase Details
Closed on
May 17, 2017
Sold by
Calaltantic Group Inc
Bought by
Jones Camus A and Chaney Jones Robin L
Current Estimated Value
Home Financials for this Owner
Home Financials are based on the most recent Mortgage that was taken out on this home.
Original Mortgage
$212,810
Outstanding Balance
$182,236
Interest Rate
5.5%
Mortgage Type
FHA
Estimated Equity
$176,121
Purchase Details
Closed on
Nov 6, 2015
Sold by
Brookmere Llc
Bought by
Calatlantic Group Inc
Purchase Details
Closed on
Jul 6, 2010
Sold by
Quality Properties Asset Management Comp
Bought by
Brookmere Llc
Create a Home Valuation Report for This Property
The Home Valuation Report is an in-depth analysis detailing your home's value as well as a comparison with similar homes in the area
Home Values in the Area
Average Home Value in this Area
Purchase History
| Date | Buyer | Sale Price | Title Company |
|---|---|---|---|
| Jones Camus A | -- | None Available | |
| Calatlantic Group Inc | $2,800,000 | Cti | |
| Brookmere Llc | $1,250,000 | None Available |
Source: Public Records
Mortgage History
| Date | Status | Borrower | Loan Amount |
|---|---|---|---|
| Open | Jones Camus A | $212,810 |
Source: Public Records
Tax History
| Year | Tax Paid | Tax Assessment Tax Assessment Total Assessment is a certain percentage of the fair market value that is determined by local assessors to be the total taxable value of land and additions on the property. | Land | Improvement |
|---|---|---|---|---|
| 2025 | $10,892 | $29,592 | $5,820 | $23,772 |
| 2024 | $10,892 | $29,592 | $5,820 | $23,772 |
| 2023 | $9,451 | $29,592 | $5,820 | $23,772 |
| 2022 | $9,451 | $21,074 | $5,022 | $16,052 |
| 2021 | $9,588 | $21,072 | $5,021 | $16,051 |
| 2020 | $9,384 | $21,072 | $5,021 | $16,051 |
| 2019 | $10,114 | $21,941 | $4,565 | $17,376 |
| 2018 | $9,964 | $21,941 | $4,565 | $17,376 |
| 2017 | $8,076 | $15,425 | $4,565 | $10,860 |
| 2016 | $402 | $776 | $776 | $0 |
| 2015 | $394 | $776 | $776 | $0 |
| 2014 | $384 | $776 | $776 | $0 |
| 2013 | $279 | $607 | $607 | $0 |
Source: Public Records
Map
Nearby Homes
- 98 Lawrence Ln
- 78 Kenneth St
- 175 Owen St
- 5102 Monroe St
- 51 Manor Dr
- 322 Central Ave
- 5620 Feathercreek Rd
- 5327 Northwestern Dr
- 5628 Crestwood Rd
- 4500 203rd St
- 153 Treehouse Rd
- 620 Larkspur Ln
- 5742 Woodgate Dr
- 763 Cambridge Ave
- 156 Cloverleaf Rd
- 133 Deerpath Rd
- 5808 Allemong Dr
- 5804 Kathryn Ln
- 154 Sundance Rd
- 40 Huntingwood Rd
Your Personal Tour Guide
Ask me questions while you tour the home.