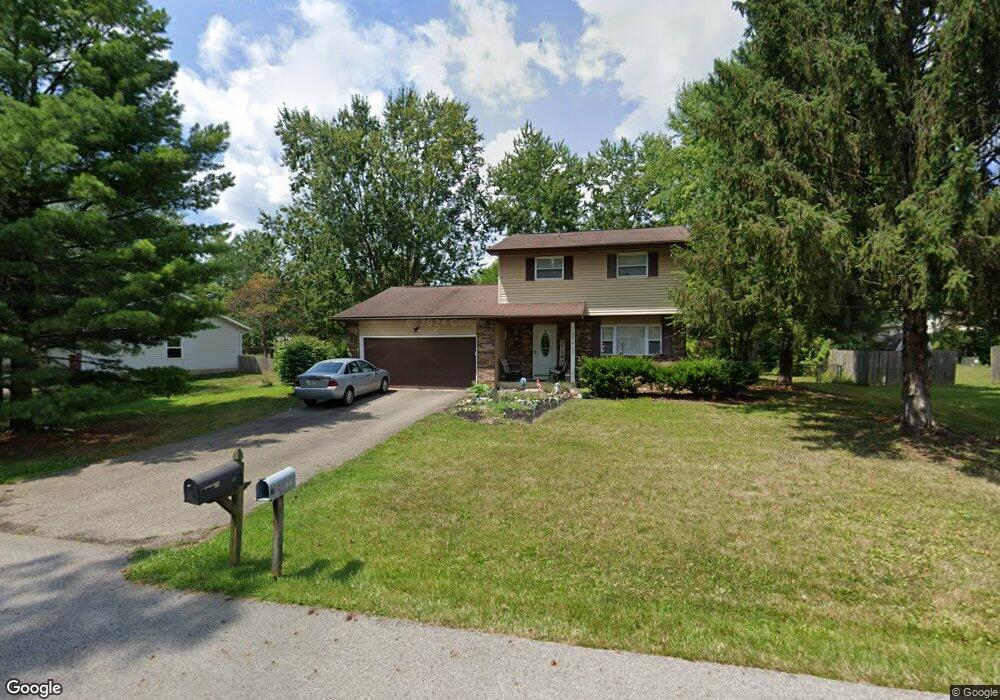
88 Carnation Place SW Etna, OH 43062
Harrison NeighborhoodEstimated Value: $337,000 - $362,610
3
Beds
3
Baths
1,952
Sq Ft
$182/Sq Ft
Est. Value
About This Home
This home is located at 88 Carnation Place SW, Etna, OH 43062 and is currently estimated at $355,903, approximately $182 per square foot. 88 Carnation Place SW is a home located in Licking County with nearby schools including Etna Elementary School, Watkins Middle School, and Watkins Memorial High School.
Ownership History
Date
Name
Owned For
Owner Type
Purchase Details
Closed on
Oct 25, 2017
Sold by
White James D
Bought by
Daw Steven L and Daw Veronica A
Current Estimated Value
Home Financials for this Owner
Home Financials are based on the most recent Mortgage that was taken out on this home.
Original Mortgage
$175,000
Outstanding Balance
$150,565
Interest Rate
3.78%
Mortgage Type
Unknown
Estimated Equity
$205,338
Purchase Details
Closed on
Oct 28, 2009
Sold by
Ungericht Joseph P and Peyton Rachael L
Bought by
White James D and White Sheila T
Home Financials for this Owner
Home Financials are based on the most recent Mortgage that was taken out on this home.
Original Mortgage
$146,880
Interest Rate
5.11%
Mortgage Type
New Conventional
Purchase Details
Closed on
Aug 20, 2001
Sold by
Ulrich Arthur J
Bought by
Ungericht Joseph P and Ungericht Rachael L
Home Financials for this Owner
Home Financials are based on the most recent Mortgage that was taken out on this home.
Original Mortgage
$127,006
Interest Rate
7.23%
Mortgage Type
FHA
Create a Home Valuation Report for This Property
The Home Valuation Report is an in-depth analysis detailing your home's value as well as a comparison with similar homes in the area
Home Values in the Area
Average Home Value in this Area
Purchase History
| Date | Buyer | Sale Price | Title Company |
|---|---|---|---|
| Daw Steven L | $175,000 | Northwest Advantage Title | |
| White James D | $144,000 | Attorney | |
| Ungericht Joseph P | $129,000 | -- |
Source: Public Records
Mortgage History
| Date | Status | Borrower | Loan Amount |
|---|---|---|---|
| Open | Daw Steven L | $175,000 | |
| Previous Owner | White James D | $146,880 | |
| Previous Owner | Ungericht Joseph P | $127,006 |
Source: Public Records
Tax History Compared to Growth
Tax History
| Year | Tax Paid | Tax Assessment Tax Assessment Total Assessment is a certain percentage of the fair market value that is determined by local assessors to be the total taxable value of land and additions on the property. | Land | Improvement |
|---|---|---|---|---|
| 2024 | $4,254 | $96,570 | $26,950 | $69,620 |
| 2023 | $4,252 | $96,570 | $26,950 | $69,620 |
| 2022 | $3,453 | $65,870 | $16,380 | $49,490 |
| 2021 | $3,477 | $65,870 | $16,380 | $49,490 |
| 2020 | $3,594 | $65,870 | $16,380 | $49,490 |
| 2019 | $3,124 | $52,190 | $12,600 | $39,590 |
| 2018 | $3,135 | $0 | $0 | $0 |
| 2017 | $2,885 | $0 | $0 | $0 |
| 2016 | $2,752 | $0 | $0 | $0 |
| 2015 | $2,658 | $0 | $0 | $0 |
| 2014 | $3,234 | $0 | $0 | $0 |
| 2013 | $2,588 | $0 | $0 | $0 |
Source: Public Records
Map
Nearby Homes
- 71 Cosmos Ln SW
- 57 Jonquil Dr SW
- 49 Iris Ct SW
- 112 Spring Brook Ct
- 10 Aster Ct SW
- 162 Spring Flower Way
- 101 Stirling Way
- 151 Whittington Place
- 104 Ravines Edge Ct
- 117 Deer Path Ct
- 17 Zellers Ln
- 8764 National Rd SW Unit 118
- 9779 York Rd SW
- 9797 York Rd SW
- 113 Covington Ln
- 7543 Palmer Rd SW
- 6903 Watkins Rd SW
- 0 Loop Rd
- 10123 Loop Rd
- 10047 Loop Rd
- 84 Carnation Place SW
- 96 Carnation Place SW
- 70 Carnation Place SW
- 91 Cosmos Ln SW
- 107 Carnation Place SW
- 51 Cosmos Ln SW
- 106 Carnation Place SW
- 52 Carnation Place SW
- 125 Carnation Place SW
- 89 Carnation Place SW
- 111 Cosmos Ln SW
- 143 Carnation Place SW
- 71 Carnation Place SW
- 31 Cosmos Ln SW
- 68 Cosmos Ln SW
- 34 Carnation Place SW
- 104 Jonquil Dr SW
- 124 Carnation Place SW
- 86 Cosmos Ln SW
- 129 Cosmos Ln SW