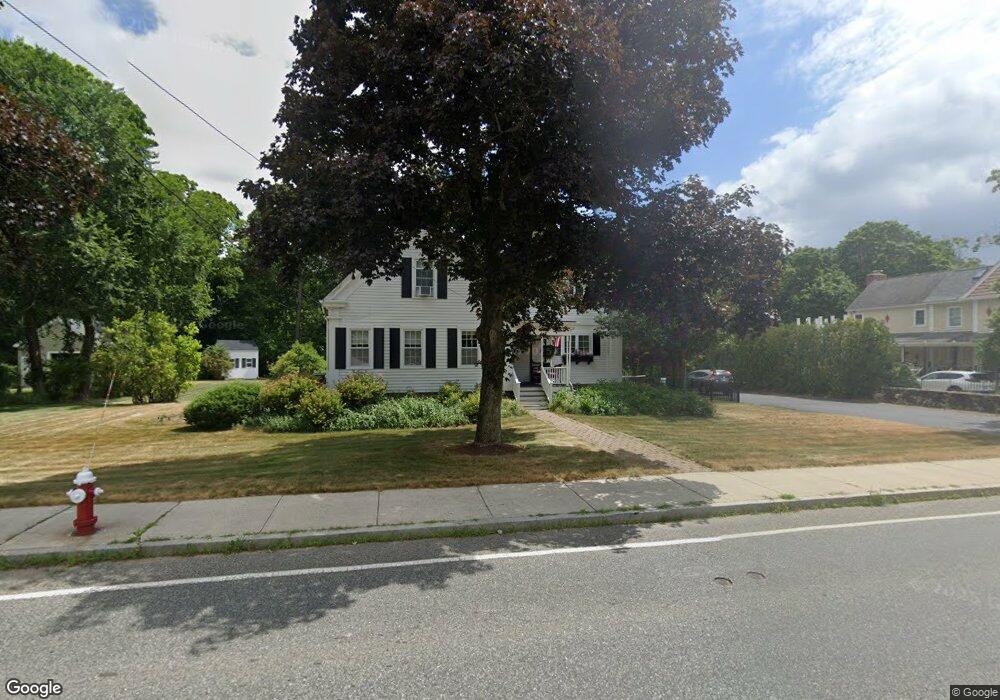
88 Central St Foxboro, MA 02035
Estimated Value: $710,000 - $924,000
About This Home
This home is located at 88 Central St, Foxboro, MA 02035 and is currently estimated at $846,608, approximately $293 per square foot. 88 Central St is a home located in Norfolk County with nearby schools including Foxborough High School, Foxborough Regional Charter School, and The Sage School.
Ownership History
We collect this data history from publicly available records. To have your information removed, we recommend requesting removal directly through your county’s website.
Purchase Details
Home Financials for this Owner
Home Financials are based on the most recent Mortgage that was taken out on this home.Purchase Details
Home Values in the Area
Average Home Value in this Area
Purchase History
We collect this data history from publicly available records. To have your information removed, we recommend requesting removal directly through your county’s website.
| Date | Buyer | Sale Price | Title Company |
|---|---|---|---|
| $590,000 | None Available | ||
| $125,000 | -- |
Mortgage History
We collect this data history from publicly available records. To have your information removed, we recommend requesting removal directly through your county’s website.
| Date | Status | Borrower | Loan Amount |
|---|---|---|---|
| Open | $472,000 | ||
| Previous Owner | $340,000 | ||
| Previous Owner | $193,600 |
Tax History
We collect this data history from publicly available records. To have your information removed, we recommend requesting removal directly through your county’s website.
| Year | Tax Paid | Tax Assessment Tax Assessment Total Assessment is a certain percentage of the fair market value that is determined by local assessors to be the total taxable value of land and additions on the property. | Land | Improvement |
|---|---|---|---|---|
| 2025 | $9,224 | $697,700 | $203,300 | $494,400 |
| 2024 | $8,971 | $664,000 | $219,100 | $444,900 |
| 2023 | $8,637 | $607,800 | $208,600 | $399,200 |
| 2022 | $8,146 | $561,000 | $186,900 | $374,100 |
| 2021 | $7,799 | $529,100 | $177,600 | $351,500 |
| 2020 | $7,289 | $500,300 | $177,600 | $322,700 |
| 2019 | $7,159 | $487,000 | $178,100 | $308,900 |
| 2018 | $6,481 | $444,800 | $169,200 | $275,600 |
| 2017 | $6,147 | $408,700 | $166,400 | $242,300 |
| 2016 | $5,962 | $402,300 | $160,200 | $242,100 |
| 2015 | $5,737 | $377,700 | $119,400 | $258,300 |
| 2014 | $5,662 | $377,700 | $119,400 | $258,300 |
Map
- 3 Summerville Rd Unit 3
- 1 Ledgeville Ave
- 9 Orchard Place Unit 9
- 12 Elm St
- 109 Cocasset St
- 226 Central St
- 2 Eisenhauer
- 147 Chestnut St Unit A
- 147 Chestnut St Unit B
- 96 Main St
- 96 Main St Unit E6
- 3 Shea Ln
- 19 Carter Rd
- 26 Fairway Ln
- 356 Central St
- 13 Old Colony Rd
- 9 Bragg Rd
- 68 Alden St
- 8 Conway Ln
- 214 Mechanic St
Ask me questions while you tour the home.