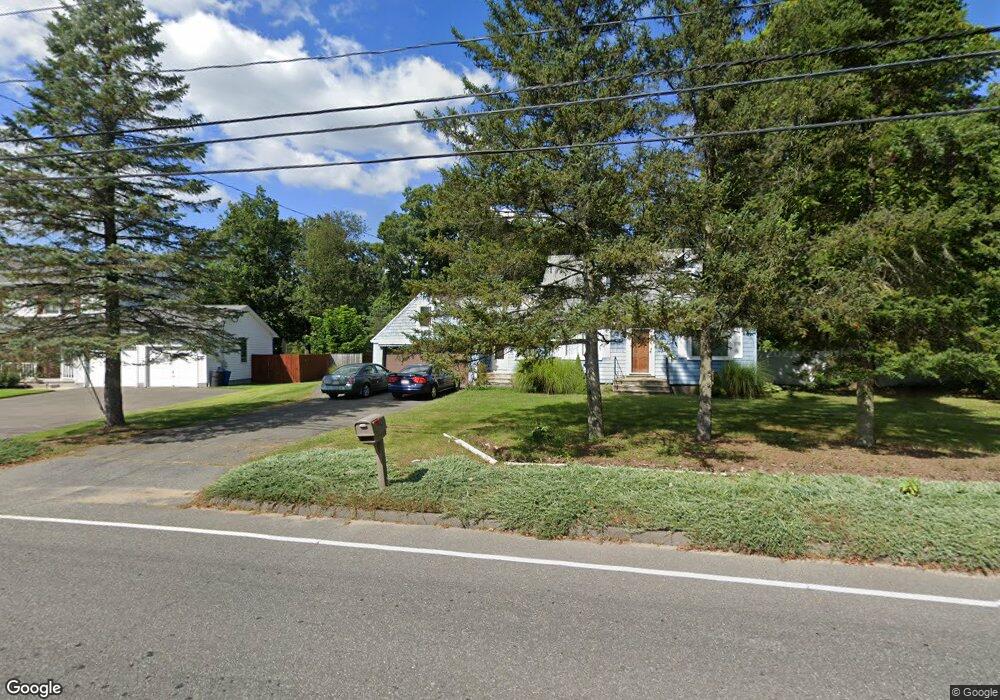
88 Chapin St Ludlow, MA 01056
Estimated Value: $278,000 - $327,000
4
Beds
1
Bath
1,212
Sq Ft
$257/Sq Ft
Est. Value
About This Home
This home is located at 88 Chapin St, Ludlow, MA 01056 and is currently estimated at $310,969, approximately $256 per square foot. 88 Chapin St is a home located in Hampden County with nearby schools including East Street Elementary School, Chapin Street Elementary School, and Paul R. Baird Middle School.
Ownership History
Date
Name
Owned For
Owner Type
Purchase Details
Closed on
Jul 21, 2003
Sold by
Dandrea Doris M
Bought by
Webb Joe and Webb Joyce M
Current Estimated Value
Home Financials for this Owner
Home Financials are based on the most recent Mortgage that was taken out on this home.
Original Mortgage
$85,500
Interest Rate
5.34%
Mortgage Type
Purchase Money Mortgage
Create a Home Valuation Report for This Property
The Home Valuation Report is an in-depth analysis detailing your home's value as well as a comparison with similar homes in the area
Home Values in the Area
Average Home Value in this Area
Purchase History
| Date | Buyer | Sale Price | Title Company |
|---|---|---|---|
| Webb Joe | $95,000 | -- | |
| Webb Joe | $95,000 | -- |
Source: Public Records
Mortgage History
| Date | Status | Borrower | Loan Amount |
|---|---|---|---|
| Open | Webb Joe | $120,000 | |
| Closed | Webb Joe | $85,500 |
Source: Public Records
Tax History Compared to Growth
Tax History
| Year | Tax Paid | Tax Assessment Tax Assessment Total Assessment is a certain percentage of the fair market value that is determined by local assessors to be the total taxable value of land and additions on the property. | Land | Improvement |
|---|---|---|---|---|
| 2025 | $4,060 | $234,000 | $67,700 | $166,300 |
| 2024 | $3,958 | $218,800 | $67,700 | $151,100 |
| 2023 | $3,639 | $186,500 | $56,200 | $130,300 |
| 2022 | $3,456 | $172,900 | $56,200 | $116,700 |
| 2021 | $3,463 | $164,300 | $56,200 | $108,100 |
| 2020 | $3,318 | $160,900 | $55,400 | $105,500 |
| 2019 | $3,086 | $155,700 | $54,900 | $100,800 |
| 2018 | $2,890 | $152,000 | $54,900 | $97,100 |
| 2017 | $2,781 | $150,100 | $55,900 | $94,200 |
| 2016 | $2,636 | $145,400 | $54,700 | $90,700 |
| 2015 | $2,474 | $143,100 | $54,200 | $88,900 |
Source: Public Records
Map
Nearby Homes
- 88-90 Miller St
- 229 Miller St Unit F-13
- 229 Miller St Unit C-1
- 229 Miller St Unit B2
- 4 Hillcrest Dr
- 22 Balsam Hill Rd
- 35 Lake Dr
- 308 Miller St Unit 72
- 308 Miller St Unit 79
- 308 Miller St Unit 78
- 2 Vista Rd
- 51 Newcrest St
- 319 Ventura St
- 54 High Pine Cir
- 1172 East St
- 46 Washington Rd
- Lot 28 Tower Rd
- 69 High Pine Cir
- 38 King Dr
- 143 James St
- 92 Chapin St
- 84 Chapin St Unit 86
- 84-86 Chapin St
- 60 Voltage Ave
- 48 Voltage Ave
- 93 Chapin St
- 78 Chapin St Unit 80
- 78-80 Chapin St
- 72 Voltage Ave
- 96 Chapin St
- 42 Voltage Ave
- 97 Chapin St
- 82 Voltage Ave
- 36 Voltage Ave
- 55 Voltage Ave
- 74 Chapin St
- 69 Voltage Ave
- 43 Voltage Ave
- 100 Chapin St
- 101 Chapin St