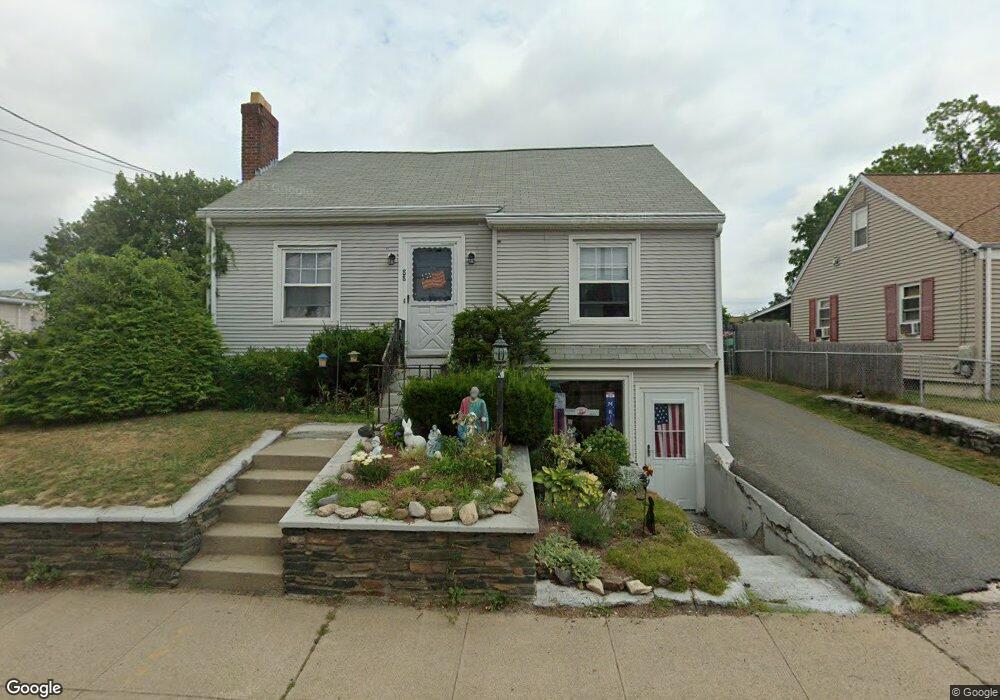
88 Columbus Ave Pawtucket, RI 02860
Beverage Hill-The Plains NeighborhoodEstimated Value: $382,000 - $461,000
3
Beds
1
Bath
1,800
Sq Ft
$228/Sq Ft
Est. Value
About This Home
This home is located at 88 Columbus Ave, Pawtucket, RI 02860 and is currently estimated at $409,739, approximately $227 per square foot. 88 Columbus Ave is a home located in Providence County with nearby schools including International Charter School, Blackstone Academy Charter School, and Saint Teresa Catholic Elementary School.
Ownership History
Date
Name
Owned For
Owner Type
Purchase Details
Closed on
Jan 4, 2022
Sold by
Amaral Mark and Amaral Sherrie A
Bought by
Amaral Sherrie A
Current Estimated Value
Home Financials for this Owner
Home Financials are based on the most recent Mortgage that was taken out on this home.
Original Mortgage
$128,000
Outstanding Balance
$117,500
Interest Rate
3.12%
Mortgage Type
New Conventional
Estimated Equity
$292,239
Purchase Details
Closed on
Dec 2, 2008
Sold by
Lunardelli Joseph A and Lunardelli Helen
Bought by
Amaral Mark and Amaral Sherrie A
Home Financials for this Owner
Home Financials are based on the most recent Mortgage that was taken out on this home.
Original Mortgage
$158,409
Interest Rate
6.47%
Mortgage Type
Purchase Money Mortgage
Create a Home Valuation Report for This Property
The Home Valuation Report is an in-depth analysis detailing your home's value as well as a comparison with similar homes in the area
Home Values in the Area
Average Home Value in this Area
Purchase History
| Date | Buyer | Sale Price | Title Company |
|---|---|---|---|
| Amaral Sherrie A | -- | None Available | |
| Amaral Sherrie A | -- | None Available | |
| Amaral Mark | $160,500 | -- | |
| Amaral Mark | $160,500 | -- |
Source: Public Records
Mortgage History
| Date | Status | Borrower | Loan Amount |
|---|---|---|---|
| Open | Amaral Sherrie A | $128,000 | |
| Closed | Amaral Sherrie A | $128,000 | |
| Previous Owner | Amaral Mark | $160,785 | |
| Previous Owner | Amaral Mark | $158,409 |
Source: Public Records
Tax History
| Year | Tax Paid | Tax Assessment Tax Assessment Total Assessment is a certain percentage of the fair market value that is determined by local assessors to be the total taxable value of land and additions on the property. | Land | Improvement |
|---|---|---|---|---|
| 2025 | $4,225 | $321,300 | $132,000 | $189,300 |
| 2024 | $3,965 | $321,300 | $132,000 | $189,300 |
| 2023 | $4,157 | $245,400 | $82,900 | $162,500 |
| 2022 | $4,069 | $245,400 | $82,900 | $162,500 |
| 2021 | $4,069 | $245,400 | $82,900 | $162,500 |
| 2020 | $3,771 | $180,500 | $57,300 | $123,200 |
| 2019 | $3,771 | $180,500 | $57,300 | $123,200 |
| 2018 | $3,633 | $180,500 | $57,300 | $123,200 |
| 2017 | $3,553 | $156,400 | $46,800 | $109,600 |
| 2016 | $3,424 | $156,400 | $46,800 | $109,600 |
| 2015 | $3,424 | $156,400 | $46,800 | $109,600 |
| 2014 | $3,341 | $144,900 | $46,800 | $98,100 |
Source: Public Records
Map
Nearby Homes
Your Personal Tour Guide
Ask me questions while you tour the home.