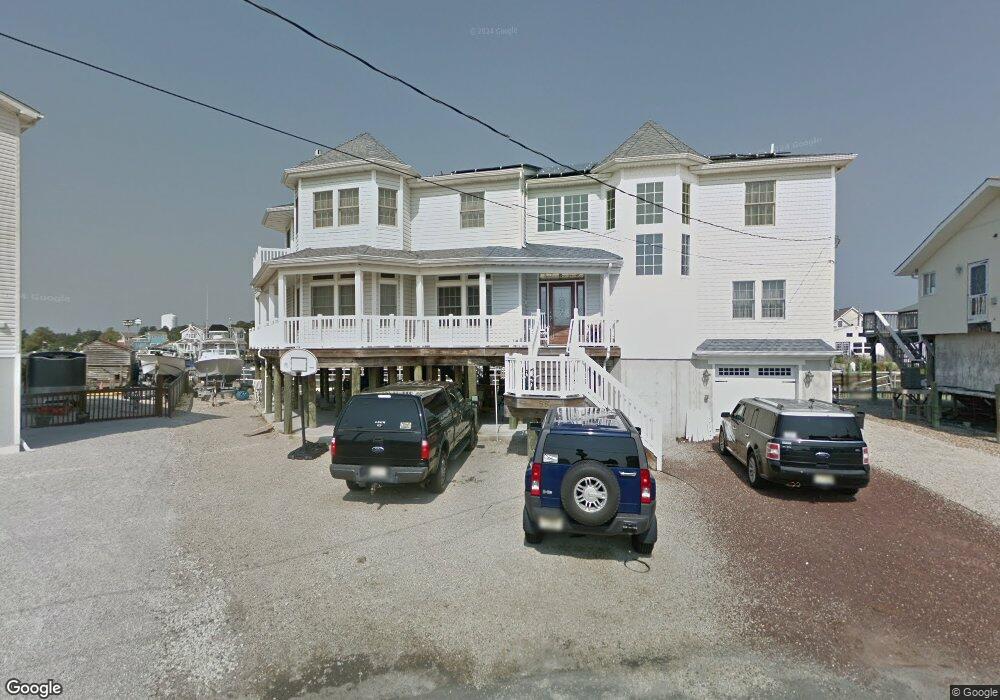
88 Dolphin Rd Tuckerton, NJ 08087
Estimated Value: $708,842 - $963,000
4
Beds
3
Baths
2,942
Sq Ft
$295/Sq Ft
Est. Value
About This Home
This home is located at 88 Dolphin Rd, Tuckerton, NJ 08087 and is currently estimated at $868,211, approximately $295 per square foot. 88 Dolphin Rd is a home located in Ocean County with nearby schools including Tuckerton Elementary School, Pinelands Regional Junior High School, and Pinelands Regional High School.
Ownership History
Date
Name
Owned For
Owner Type
Purchase Details
Closed on
Apr 30, 2015
Sold by
Donofrio Velma R
Bought by
Ditzel Velma R and Ditzel Lawrence F
Current Estimated Value
Purchase Details
Closed on
Mar 26, 1999
Sold by
Medveckus Joseph P and Gallen Barbara J
Bought by
Donofrio Velma R
Purchase Details
Closed on
May 16, 1995
Sold by
Silva James
Bought by
Medeckus Joseph and Gallen Barbara
Home Financials for this Owner
Home Financials are based on the most recent Mortgage that was taken out on this home.
Original Mortgage
$67,000
Interest Rate
8.34%
Create a Home Valuation Report for This Property
The Home Valuation Report is an in-depth analysis detailing your home's value as well as a comparison with similar homes in the area
Home Values in the Area
Average Home Value in this Area
Purchase History
| Date | Buyer | Sale Price | Title Company |
|---|---|---|---|
| Ditzel Velma R | -- | Attorney | |
| Donofrio Velma R | $86,000 | -- | |
| Medeckus Joseph | $74,000 | -- |
Source: Public Records
Mortgage History
| Date | Status | Borrower | Loan Amount |
|---|---|---|---|
| Previous Owner | Medeckus Joseph | $67,000 |
Source: Public Records
Tax History Compared to Growth
Tax History
| Year | Tax Paid | Tax Assessment Tax Assessment Total Assessment is a certain percentage of the fair market value that is determined by local assessors to be the total taxable value of land and additions on the property. | Land | Improvement |
|---|---|---|---|---|
| 2025 | $14,492 | $467,800 | $122,600 | $345,200 |
| 2024 | $13,201 | $467,800 | $122,600 | $345,200 |
| 2023 | $12,359 | $467,800 | $122,600 | $345,200 |
| 2022 | $12,359 | $467,800 | $122,600 | $345,200 |
| 2021 | $11,254 | $467,800 | $122,600 | $345,200 |
| 2020 | $12,256 | $467,800 | $122,600 | $345,200 |
| 2019 | $12,233 | $467,800 | $122,600 | $345,200 |
| 2018 | $10,898 | $427,200 | $122,400 | $304,800 |
| 2017 | $10,390 | $427,200 | $122,400 | $304,800 |
| 2016 | $9,847 | $427,200 | $122,400 | $304,800 |
| 2015 | $9,727 | $427,200 | $122,400 | $304,800 |
| 2014 | $11,607 | $512,900 | $230,400 | $282,500 |
Source: Public Records
Map
Nearby Homes