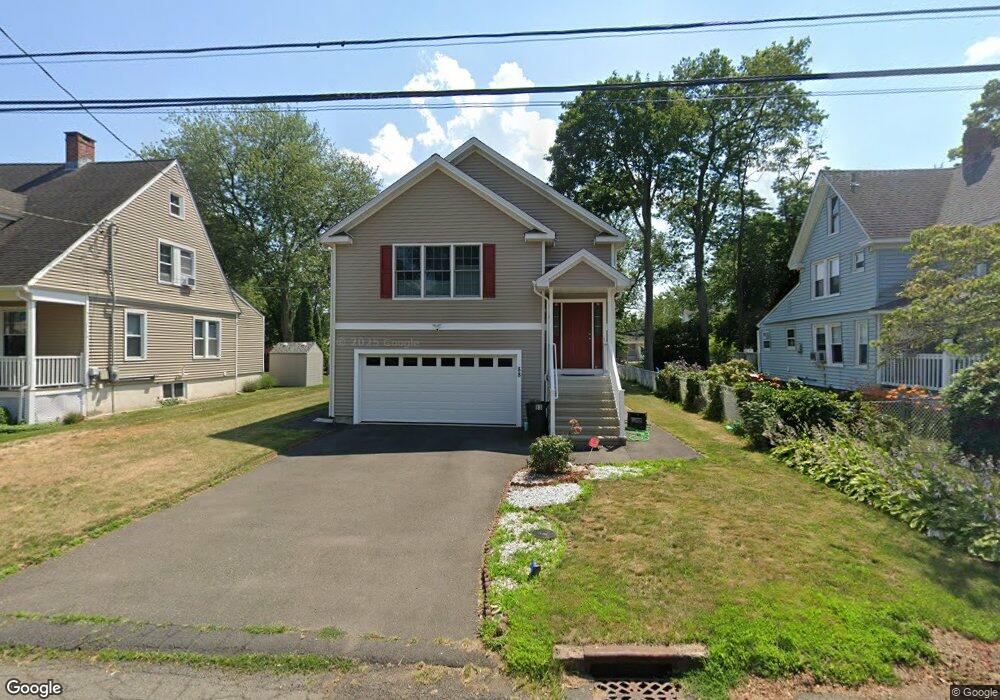
88 Frank St East Haven, CT 06512
Estimated Value: $486,000 - $591,000
3
Beds
3
Baths
1,498
Sq Ft
$355/Sq Ft
Est. Value
About This Home
This home is located at 88 Frank St, East Haven, CT 06512 and is currently estimated at $531,685, approximately $354 per square foot. 88 Frank St is a home located in New Haven County with nearby schools including East Haven High School, All Nations Christian Academy, and Pathway School.
Ownership History
Date
Name
Owned For
Owner Type
Purchase Details
Closed on
Apr 17, 2015
Sold by
Asm Prospect Llc
Bought by
Patel Brijesh and Patel Nisha
Current Estimated Value
Home Financials for this Owner
Home Financials are based on the most recent Mortgage that was taken out on this home.
Original Mortgage
$190,000
Outstanding Balance
$146,159
Interest Rate
3.72%
Mortgage Type
Purchase Money Mortgage
Estimated Equity
$385,526
Create a Home Valuation Report for This Property
The Home Valuation Report is an in-depth analysis detailing your home's value as well as a comparison with similar homes in the area
Home Values in the Area
Average Home Value in this Area
Purchase History
| Date | Buyer | Sale Price | Title Company |
|---|---|---|---|
| Patel Brijesh | $290,000 | -- |
Source: Public Records
Mortgage History
| Date | Status | Borrower | Loan Amount |
|---|---|---|---|
| Open | Patel Brijesh | $190,000 |
Source: Public Records
Tax History Compared to Growth
Tax History
| Year | Tax Paid | Tax Assessment Tax Assessment Total Assessment is a certain percentage of the fair market value that is determined by local assessors to be the total taxable value of land and additions on the property. | Land | Improvement |
|---|---|---|---|---|
| 2025 | $8,268 | $247,240 | $53,620 | $193,620 |
| 2024 | $8,268 | $247,240 | $53,620 | $193,620 |
| 2023 | $7,714 | $247,240 | $53,620 | $193,620 |
| 2022 | $7,513 | $240,800 | $53,620 | $187,180 |
| 2021 | $6,990 | $204,080 | $50,630 | $153,450 |
| 2020 | $6,990 | $204,080 | $50,630 | $153,450 |
| 2019 | $6,616 | $204,080 | $50,630 | $153,450 |
| 2018 | $6,622 | $204,080 | $50,630 | $153,450 |
| 2017 | $6,439 | $204,080 | $50,630 | $153,450 |
| 2016 | $6,953 | $220,370 | $49,050 | $171,320 |
| 2015 | $6,953 | $220,370 | $49,050 | $171,320 |
Source: Public Records
Map
Nearby Homes