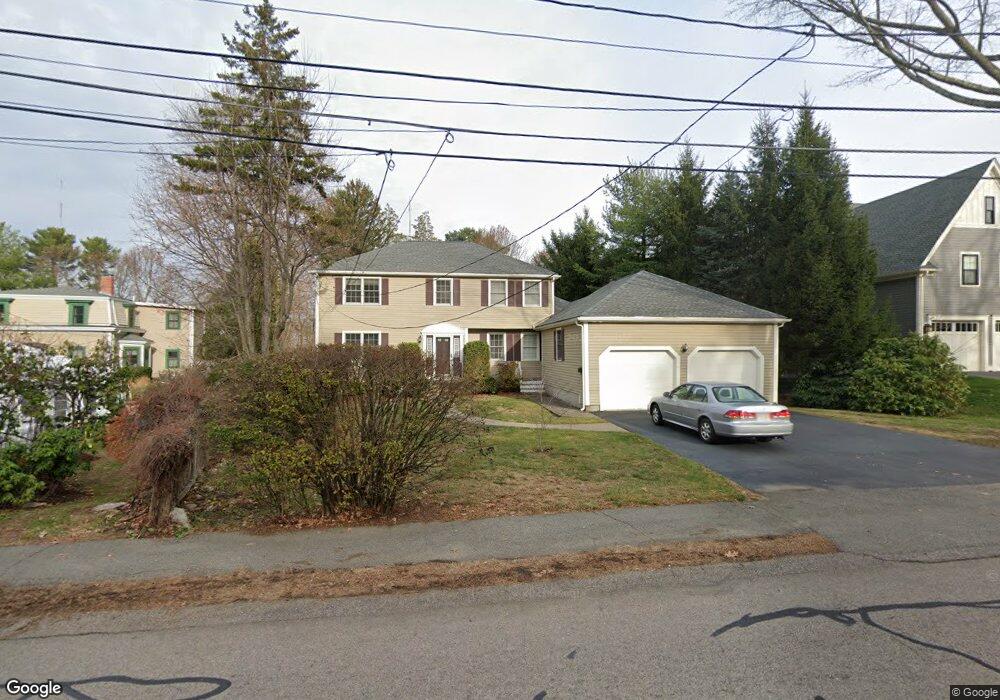
88 Greendale Ave Needham, MA 02494
Estimated Value: $1,557,000 - $1,730,000
4
Beds
4
Baths
1,436
Sq Ft
$1,159/Sq Ft
Est. Value
About This Home
This home is located at 88 Greendale Ave, Needham, MA 02494 and is currently estimated at $1,663,673, approximately $1,158 per square foot. 88 Greendale Ave is a home located in Norfolk County with nearby schools including Eliot Elementary School, High Rock Middle School, and Pollard Middle School.
Ownership History
Date
Name
Owned For
Owner Type
Purchase Details
Closed on
Jan 8, 2010
Sold by
Cowles David T and Cowles Carol S
Bought by
Chen Ronghua and Guo Jie
Current Estimated Value
Home Financials for this Owner
Home Financials are based on the most recent Mortgage that was taken out on this home.
Original Mortgage
$300,000
Interest Rate
4.78%
Mortgage Type
Purchase Money Mortgage
Purchase Details
Closed on
Aug 1, 2002
Sold by
Cannon Stephen C
Bought by
Cowles David T and Cowles Carol S
Purchase Details
Closed on
Sep 21, 1998
Sold by
Rustgi Anil K
Bought by
Cannon Stephen C
Purchase Details
Closed on
Jun 26, 1996
Sold by
Fryer Robert L and Fryer Elizabeth S
Bought by
Rustgi Anil K
Purchase Details
Closed on
Mar 9, 1994
Sold by
Quohog T
Bought by
Fryer Robert L and Fryer Elizabeth S
Create a Home Valuation Report for This Property
The Home Valuation Report is an in-depth analysis detailing your home's value as well as a comparison with similar homes in the area
Home Values in the Area
Average Home Value in this Area
Purchase History
| Date | Buyer | Sale Price | Title Company |
|---|---|---|---|
| Chen Ronghua | $758,000 | -- | |
| Chen Ronghua | $758,000 | -- | |
| Cowles David T | $741,000 | -- | |
| Cowles David T | $741,000 | -- | |
| Cannon Stephen C | $489,500 | -- | |
| Cannon Stephen C | $489,500 | -- | |
| Rustgi Anil K | $434,000 | -- | |
| Rustgi Anil K | $434,000 | -- | |
| Fryer Robert L | $398,070 | -- | |
| Fryer Robert L | $398,070 | -- |
Source: Public Records
Mortgage History
| Date | Status | Borrower | Loan Amount |
|---|---|---|---|
| Open | Fryer Robert L | $280,000 | |
| Closed | Chen Ronghua | $300,000 |
Source: Public Records
Tax History
| Year | Tax Paid | Tax Assessment Tax Assessment Total Assessment is a certain percentage of the fair market value that is determined by local assessors to be the total taxable value of land and additions on the property. | Land | Improvement |
|---|---|---|---|---|
| 2025 | $14,835 | $1,399,500 | $717,000 | $682,500 |
| 2024 | $12,783 | $1,021,000 | $483,500 | $537,500 |
| 2023 | $12,693 | $973,400 | $483,500 | $489,900 |
| 2022 | $11,966 | $895,000 | $425,900 | $469,100 |
| 2021 | $11,662 | $895,000 | $425,900 | $469,100 |
| 2020 | $11,204 | $897,000 | $425,900 | $471,100 |
| 2019 | $10,509 | $848,200 | $388,500 | $459,700 |
| 2018 | $10,077 | $848,200 | $388,500 | $459,700 |
| 2017 | $9,429 | $793,000 | $388,500 | $404,500 |
| 2016 | $9,151 | $793,000 | $388,500 | $404,500 |
| 2015 | $8,953 | $793,000 | $388,500 | $404,500 |
| 2014 | $8,694 | $746,900 | $354,500 | $392,400 |
Source: Public Records
Map
Nearby Homes
- 28 Mercer Rd
- 100 Woodbine Cir
- 108 Woodbine Cir
- 55 Burnside Rd
- 7 West St
- 5 Hazel Ln
- 143 Hunting Rd
- 5 Sachem Rd
- 132 Hillside Ave
- 24 Mellen St
- 134 Hillside Ave Unit 134
- 140 Hillside Ave
- 140 Hillside Ave Unit a
- 218 Hillside Ave
- 510 Webster St
- 379 Hunnewell St Unit 379
- 58 Morton St
- 62 Evelyn Rd
- 4 Greenough St
- 385 Hillside Ave
- 88 Greendale Ave
- 88 Greendale Ave
- 96 Greendale Ave
- 80 Greendale Ave
- 87 Charles Ct
- 87 Greendale Ave
- 100 Greendale Ave
- 97 Greendale Ave
- 81 Greendale Ave
- 76 Greendale Ave
- 75 Greendale Ave Unit 2
- 75 Greendale Ave
- 112 Greendale Ave
- 64 Woodbine Cir
- 67 Greendale Ave
- 70 Greendale Ave
- 107 Greendale Ave
- 15 Spring Rd
- 70 Woodbine Cir
- 76 Woodbine Cir
Your Personal Tour Guide
Ask me questions while you tour the home.