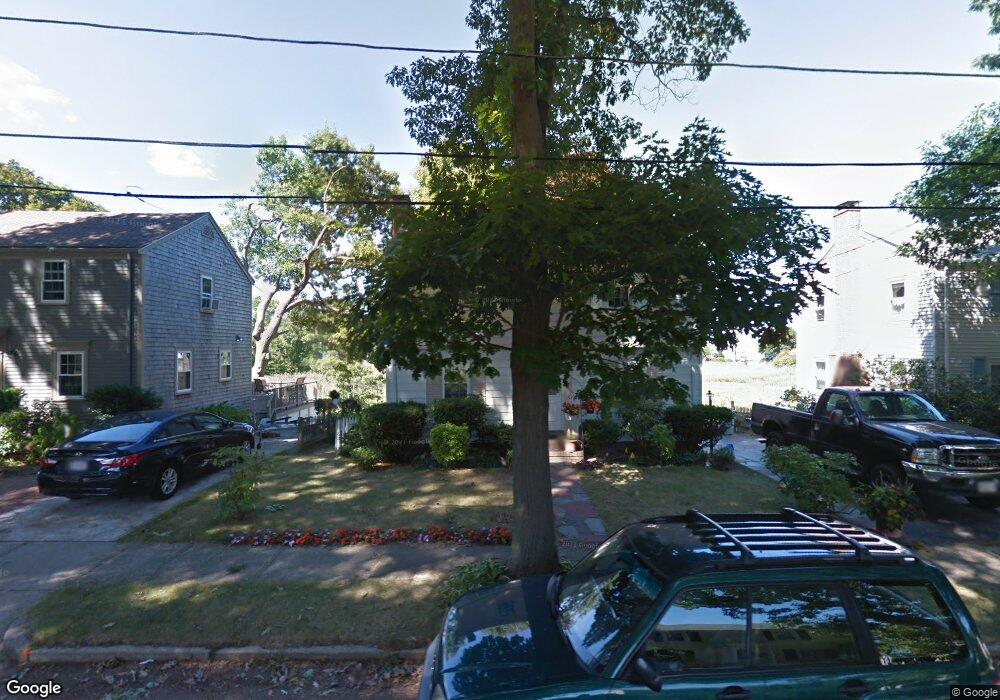
88 Havilend St Quincy, MA 02170
Wollaston NeighborhoodEstimated Value: $700,000 - $800,000
3
Beds
2
Baths
1,340
Sq Ft
$547/Sq Ft
Est. Value
About This Home
This home is located at 88 Havilend St, Quincy, MA 02170 and is currently estimated at $732,980, approximately $547 per square foot. 88 Havilend St is a home located in Norfolk County with nearby schools including Beechwood Knoll Elementary School, Central Middle School, and North Quincy High School.
Ownership History
Date
Name
Owned For
Owner Type
Purchase Details
Closed on
Aug 28, 2019
Sold by
Evans James
Bought by
Evans Ret 2019
Current Estimated Value
Purchase Details
Closed on
Sep 28, 2001
Sold by
Mccartney Arlene M
Bought by
Evans James M
Home Financials for this Owner
Home Financials are based on the most recent Mortgage that was taken out on this home.
Original Mortgage
$90,000
Interest Rate
6.91%
Mortgage Type
Purchase Money Mortgage
Create a Home Valuation Report for This Property
The Home Valuation Report is an in-depth analysis detailing your home's value as well as a comparison with similar homes in the area
Home Values in the Area
Average Home Value in this Area
Purchase History
| Date | Buyer | Sale Price | Title Company |
|---|---|---|---|
| Evans Ret 2019 | -- | -- | |
| Evans James M | $325,000 | -- | |
| Evans James M | $325,000 | -- |
Source: Public Records
Mortgage History
| Date | Status | Borrower | Loan Amount |
|---|---|---|---|
| Previous Owner | Evans James M | $90,000 | |
| Previous Owner | Evans James M | $90,000 |
Source: Public Records
Tax History
| Year | Tax Paid | Tax Assessment Tax Assessment Total Assessment is a certain percentage of the fair market value that is determined by local assessors to be the total taxable value of land and additions on the property. | Land | Improvement |
|---|---|---|---|---|
| 2025 | $6,865 | $595,400 | $333,800 | $261,600 |
| 2024 | $6,650 | $590,100 | $333,800 | $256,300 |
| 2023 | $6,193 | $556,400 | $317,900 | $238,500 |
| 2022 | $5,652 | $471,800 | $254,300 | $217,500 |
| 2021 | $5,632 | $463,900 | $254,300 | $209,600 |
| 2020 | $5,500 | $442,500 | $254,300 | $188,200 |
| 2019 | $5,336 | $425,200 | $237,700 | $187,500 |
| 2018 | $5,199 | $389,700 | $216,100 | $173,600 |
| 2017 | $5,292 | $373,500 | $216,100 | $157,400 |
| 2016 | $4,948 | $344,600 | $196,400 | $148,200 |
| 2015 | $4,593 | $314,600 | $178,600 | $136,000 |
| 2014 | $4,381 | $294,800 | $170,100 | $124,700 |
Source: Public Records
Map
Nearby Homes
- 11 Cleaves St
- 144 Kemper St
- 22 Newton Ave
- 28 Apthorp St
- 20 Ellington Rd
- 915 Hancock St Unit 2
- 27 Herbert Rd
- 245 Sea St Unit 45
- 105 Sea St Unit 105
- 105 Sea St Unit 102
- 10 Weston Ave Unit 322
- 1025 Hancock St Unit 6J
- 1025 Hancock St Unit 2K
- 59 Terne Rd
- 72 Oakland Ave
- 25 Moffat Rd
- 11 Plover Rd
- 267-269 Farrington St
- 28 Edgewood Cir
- 10 Presidents Ln Unit 10
Your Personal Tour Guide
Ask me questions while you tour the home.