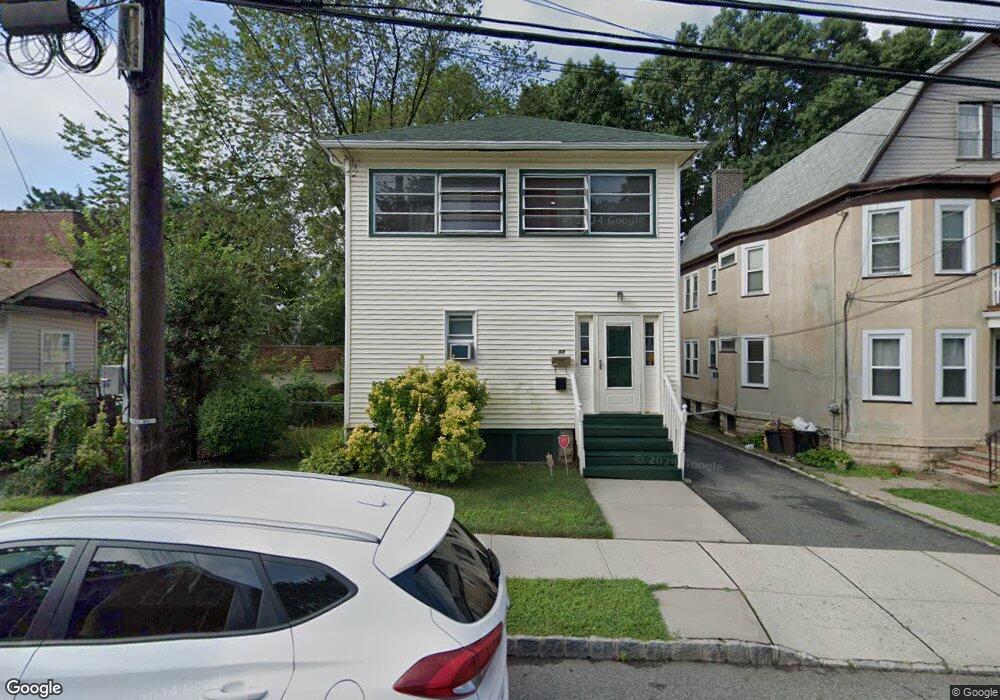
88 Maple St Unit 2 West Orange, NJ 07052
Estimated Value: $585,000 - $684,000
2
Beds
1
Bath
2,199
Sq Ft
$283/Sq Ft
Est. Value
About This Home
This home is located at 88 Maple St Unit 2, West Orange, NJ 07052 and is currently estimated at $621,860, approximately $282 per square foot. 88 Maple St Unit 2 is a home located in Essex County with nearby schools including West Orange High School and Mount Carmel Guild Academy.
Ownership History
Date
Name
Owned For
Owner Type
Purchase Details
Closed on
Apr 25, 1996
Sold by
Derosa Stpehen
Bought by
Henry Harold and Henry Laverene
Current Estimated Value
Home Financials for this Owner
Home Financials are based on the most recent Mortgage that was taken out on this home.
Original Mortgage
$184,000
Outstanding Balance
$10,265
Interest Rate
7.77%
Mortgage Type
VA
Estimated Equity
$611,595
Purchase Details
Closed on
Dec 1, 1992
Sold by
Derosa Stephen and Derosa Bonora,John P
Bought by
Derosa Stephen and Derosa Paulette
Purchase Details
Closed on
Nov 2, 1990
Sold by
Giblin Patrick and Giblin Joanna
Bought by
Derosa Derosa S and Derosa P
Create a Home Valuation Report for This Property
The Home Valuation Report is an in-depth analysis detailing your home's value as well as a comparison with similar homes in the area
Home Values in the Area
Average Home Value in this Area
Purchase History
| Date | Buyer | Sale Price | Title Company |
|---|---|---|---|
| Henry Harold | $180,000 | -- | |
| Derosa Stephen | -- | -- | |
| Derosa Derosa S | $190,000 | -- |
Source: Public Records
Mortgage History
| Date | Status | Borrower | Loan Amount |
|---|---|---|---|
| Open | Henry Harold | $184,000 |
Source: Public Records
Tax History Compared to Growth
Tax History
| Year | Tax Paid | Tax Assessment Tax Assessment Total Assessment is a certain percentage of the fair market value that is determined by local assessors to be the total taxable value of land and additions on the property. | Land | Improvement |
|---|---|---|---|---|
| 2025 | $12,424 | $504,400 | $164,400 | $340,000 |
| 2024 | $12,424 | $270,200 | $100,200 | $170,000 |
| 2022 | $11,989 | $270,200 | $100,200 | $170,000 |
| 2021 | $11,765 | $270,200 | $100,200 | $170,000 |
| 2020 | $11,575 | $270,200 | $100,200 | $170,000 |
| 2019 | $11,243 | $270,200 | $100,200 | $170,000 |
| 2018 | $10,911 | $270,200 | $100,200 | $170,000 |
| 2017 | $10,770 | $270,200 | $100,200 | $170,000 |
| 2016 | $10,511 | $270,200 | $100,200 | $170,000 |
| 2015 | $10,314 | $270,200 | $100,200 | $170,000 |
| 2014 | $10,111 | $270,200 | $100,200 | $170,000 |
Source: Public Records
Map
Nearby Homes
- 77 Harrison Ave Unit 79
- 79 Harrison Ave
- 7 Virginia Ave
- 102 Harrison Ave
- 3 Winfield St
- 5 Franklin Ave
- 7 Franklin Ave
- 42 Franklin Place
- 194 Harrison Ave
- 2 Fremont St
- 17 Parkside Ave
- 175 Harrison Ave
- 132 Franklin Ave
- 350 Main St
- 20 Valley Way
- 29 Enfield Ave
- 36 William St
- 107 High St
- 110 Whittlesey Ave
- 6 Prospect Place