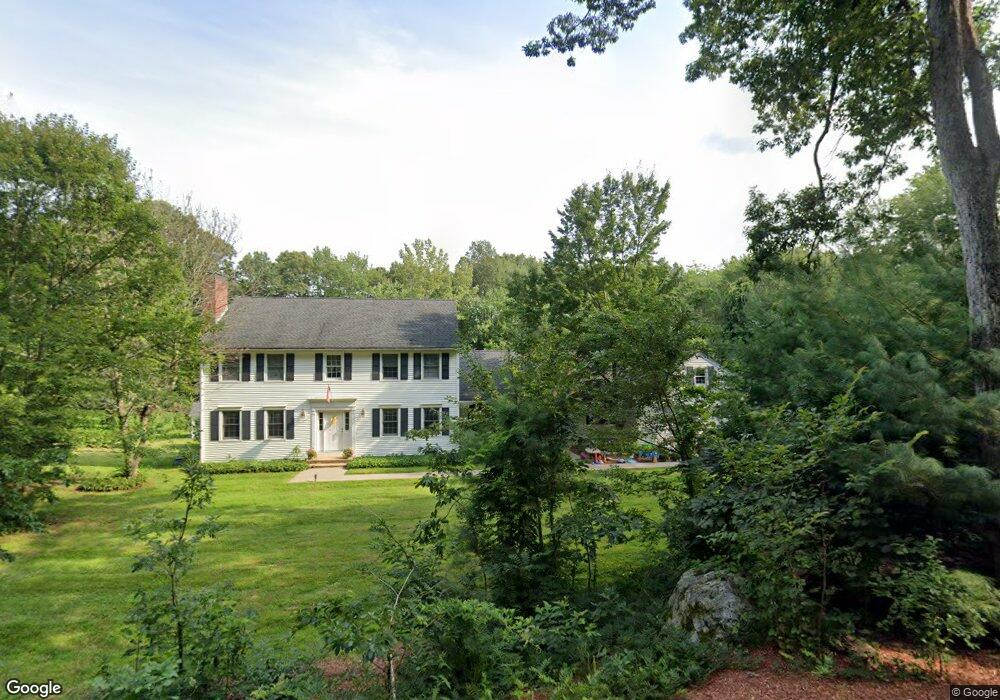
88 Merriam Rd Grafton, MA 01519
Estimated Value: $821,000 - $999,000
3
Beds
3
Baths
3,060
Sq Ft
$294/Sq Ft
Est. Value
About This Home
This home is located at 88 Merriam Rd, Grafton, MA 01519 and is currently estimated at $898,160, approximately $293 per square foot. 88 Merriam Rd is a home located in Worcester County with nearby schools including Grafton High School, Silver Spruce Montessori School, and Touchstone Community School.
Ownership History
Date
Name
Owned For
Owner Type
Purchase Details
Closed on
Mar 15, 2024
Sold by
Kastler Kim D and Liller John A
Bought by
Chalupka Norman F and Chalupka Stephanie M
Current Estimated Value
Purchase Details
Closed on
Jul 14, 2023
Sold by
Martin Carlton B
Bought by
Chalupka Norman F and Chalupka Stephanie M
Create a Home Valuation Report for This Property
The Home Valuation Report is an in-depth analysis detailing your home's value as well as a comparison with similar homes in the area
Home Values in the Area
Average Home Value in this Area
Purchase History
| Date | Buyer | Sale Price | Title Company |
|---|---|---|---|
| Chalupka Norman F | -- | None Available | |
| Chalupka Norman F | -- | None Available | |
| Chalupka Norman F | -- | None Available | |
| Chalupka Norman F | -- | None Available | |
| Chalupka Norman F | -- | None Available | |
| Chalupka Norman F | -- | None Available |
Source: Public Records
Tax History Compared to Growth
Tax History
| Year | Tax Paid | Tax Assessment Tax Assessment Total Assessment is a certain percentage of the fair market value that is determined by local assessors to be the total taxable value of land and additions on the property. | Land | Improvement |
|---|---|---|---|---|
| 2025 | $10,310 | $739,600 | $196,300 | $543,300 |
| 2024 | $10,166 | $710,400 | $190,500 | $519,900 |
| 2023 | $9,413 | $599,200 | $190,500 | $408,700 |
| 2022 | $8,870 | $525,500 | $168,100 | $357,400 |
| 2021 | $8,896 | $517,800 | $155,800 | $362,000 |
| 2020 | $8,501 | $515,200 | $155,800 | $359,400 |
| 2019 | $8,778 | $526,900 | $173,400 | $353,500 |
| 2018 | $8,773 | $528,800 | $172,000 | $356,800 |
| 2017 | $8,061 | $491,500 | $134,700 | $356,800 |
| 2016 | $8,655 | $516,700 | $180,200 | $336,500 |
| 2015 | $8,578 | $519,900 | $180,200 | $339,700 |
| 2014 | $7,690 | $503,900 | $180,200 | $323,700 |
Source: Public Records
Map
Nearby Homes