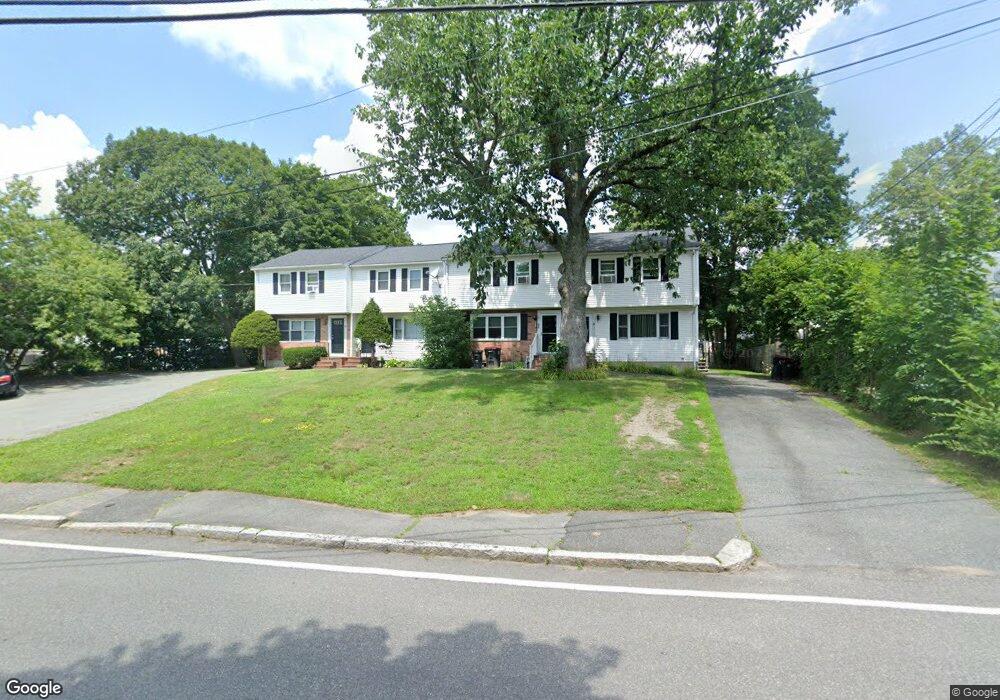
88 Pine St Brockton, MA 02302
Estimated Value: $307,000 - $352,000
2
Beds
2
Baths
1,016
Sq Ft
$316/Sq Ft
Est. Value
About This Home
This home is located at 88 Pine St, Brockton, MA 02302 and is currently estimated at $320,931, approximately $315 per square foot. 88 Pine St is a home located in Plymouth County with nearby schools including Brookfield Elementary School, Downey Elementary School, and Mary E. Baker Elementary School.
Ownership History
Date
Name
Owned For
Owner Type
Purchase Details
Closed on
Dec 11, 2007
Sold by
Laverse Rose
Bought by
Reggio Michelle E
Current Estimated Value
Purchase Details
Closed on
May 31, 2005
Sold by
Hill Robert W and Hill Brigitte V
Bought by
Laverse Rose
Purchase Details
Closed on
Jan 26, 2004
Sold by
Sessine John G
Bought by
Hill Robert W and Hill Brigitte
Purchase Details
Closed on
Oct 12, 2000
Sold by
Piver Anthony T and Piver James C
Bought by
Sessine John G
Purchase Details
Closed on
Aug 16, 1990
Sold by
B A P Trust
Bought by
Piver Anthony T
Purchase Details
Closed on
Mar 8, 1990
Sold by
Addison Pl Condo T
Bought by
Piver Anthony T
Create a Home Valuation Report for This Property
The Home Valuation Report is an in-depth analysis detailing your home's value as well as a comparison with similar homes in the area
Purchase History
| Date | Buyer | Sale Price | Title Company |
|---|---|---|---|
| Reggio Michelle E | -- | -- | |
| Laverse Rose | $211,500 | -- | |
| Hill Robert W | $168,000 | -- | |
| Sessine John G | $115,000 | -- | |
| Piver Anthony T | $110,000 | -- | |
| Piver Anthony T | $110,000 | -- |
Source: Public Records
Mortgage History
| Date | Status | Borrower | Loan Amount |
|---|---|---|---|
| Open | Piver Anthony T | $216,501 | |
| Closed | Piver Anthony T | $213,302 |
Source: Public Records
Tax History
| Year | Tax Paid | Tax Assessment Tax Assessment Total Assessment is a certain percentage of the fair market value that is determined by local assessors to be the total taxable value of land and additions on the property. | Land | Improvement |
|---|---|---|---|---|
| 2025 | $3,044 | $251,400 | $0 | $251,400 |
| 2024 | $2,854 | $237,400 | $0 | $237,400 |
| 2023 | $2,793 | $215,200 | $0 | $215,200 |
| 2022 | $2,615 | $187,200 | $0 | $187,200 |
| 2021 | $2,311 | $159,400 | $0 | $159,400 |
| 2020 | $2,513 | $165,900 | $0 | $165,900 |
| 2019 | $2,168 | $139,500 | $0 | $139,500 |
| 2018 | $1,913 | $119,100 | $0 | $119,100 |
| 2017 | $1,779 | $110,500 | $0 | $110,500 |
| 2016 | $1,918 | $110,500 | $0 | $110,500 |
| 2015 | $1,712 | $94,340 | $0 | $94,340 |
| 2014 | $1,505 | $83,020 | $0 | $83,020 |
Source: Public Records
Map
Nearby Homes
- 70 Pine St
- 5 Bates St
- 49 Martin St
- 519 Crescent St
- 202 Summer St
- 46 Otis St
- 13 Standish St
- 4 Virginia Ave
- 383 Summer St
- 29 Hunt St
- 23 Ridgeway Ct Unit 23
- 28 Clinton St
- 18 Lawrence St
- 40 Austin Ct Unit Lot 3
- 100 Concord St
- 51 Sterling Rd
- 146 Court St Unit 108
- 111 Riverview St
- 112 Hillside Ave
- 58 Budd Ave
Your Personal Tour Guide
Ask me questions while you tour the home.