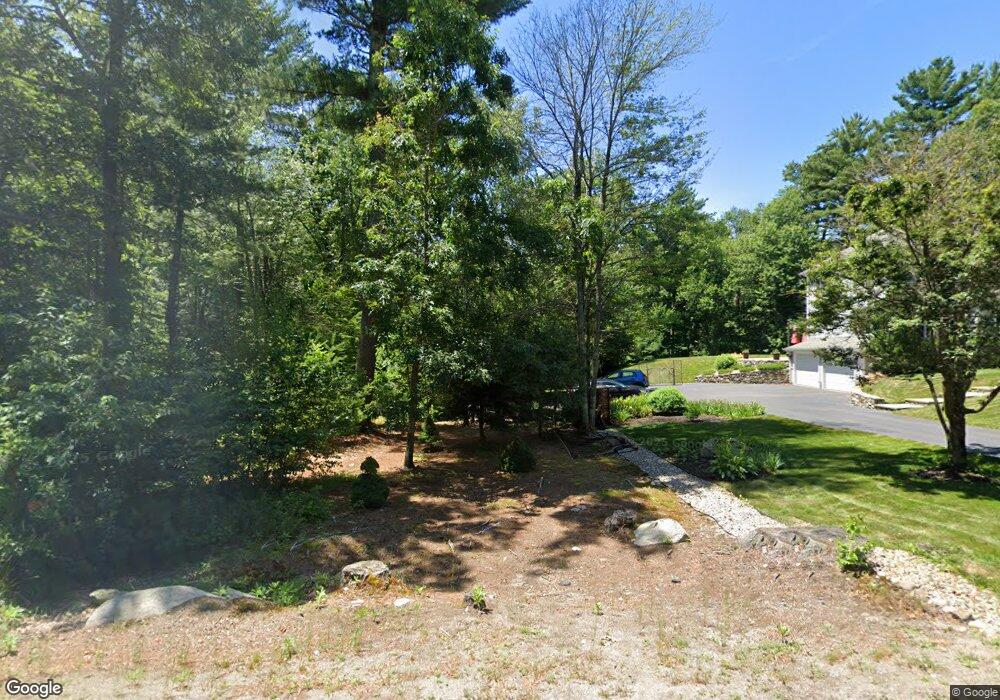
88 Reed St Hanson, MA 02341
Estimated Value: $884,973 - $974,000
3
Beds
3
Baths
3,153
Sq Ft
$293/Sq Ft
Est. Value
About This Home
This home is located at 88 Reed St, Hanson, MA 02341 and is currently estimated at $924,743, approximately $293 per square foot. 88 Reed St is a home located in Plymouth County.
Ownership History
Date
Name
Owned For
Owner Type
Purchase Details
Closed on
Oct 7, 2009
Sold by
Ebert Christopher J and Ebert Nichole M
Bought by
Jenney Elaine
Current Estimated Value
Home Financials for this Owner
Home Financials are based on the most recent Mortgage that was taken out on this home.
Original Mortgage
$366,000
Interest Rate
5.14%
Purchase Details
Closed on
Feb 22, 2007
Sold by
Great Cedar Rt and Costa Paul M
Bought by
Ebert Christopher J and Ebert Nichole M
Home Financials for this Owner
Home Financials are based on the most recent Mortgage that was taken out on this home.
Original Mortgage
$83,250
Interest Rate
6.23%
Mortgage Type
Purchase Money Mortgage
Create a Home Valuation Report for This Property
The Home Valuation Report is an in-depth analysis detailing your home's value as well as a comparison with similar homes in the area
Home Values in the Area
Average Home Value in this Area
Purchase History
| Date | Buyer | Sale Price | Title Company |
|---|---|---|---|
| Jenney Elaine | -- | -- | |
| Ebert Christopher J | $92,500 | -- |
Source: Public Records
Mortgage History
| Date | Status | Borrower | Loan Amount |
|---|---|---|---|
| Open | Ebert Christopher J | $369,000 | |
| Closed | Ebert Christopher J | $366,000 | |
| Previous Owner | Ebert Christopher J | $343,000 | |
| Previous Owner | Ebert Christopher J | $83,250 |
Source: Public Records
Tax History
| Year | Tax Paid | Tax Assessment Tax Assessment Total Assessment is a certain percentage of the fair market value that is determined by local assessors to be the total taxable value of land and additions on the property. | Land | Improvement |
|---|---|---|---|---|
| 2025 | $10,448 | $780,900 | $178,000 | $602,900 |
| 2024 | $10,240 | $765,300 | $172,800 | $592,500 |
| 2023 | $9,675 | $682,300 | $172,800 | $509,500 |
| 2022 | $9,448 | $626,100 | $157,000 | $469,100 |
| 2021 | $8,609 | $570,100 | $151,000 | $419,100 |
| 2020 | $8,484 | $555,600 | $145,800 | $409,800 |
| 2019 | $7,852 | $505,600 | $128,300 | $377,300 |
| 2018 | $7,766 | $490,600 | $123,400 | $367,200 |
| 2017 | $7,531 | $471,300 | $117,500 | $353,800 |
| 2016 | $7,611 | $459,900 | $117,500 | $342,400 |
| 2015 | $7,174 | $450,600 | $117,500 | $333,100 |
Source: Public Records
Map
Nearby Homes
- 1054 Main St
- 72 Phillips St
- 318 South St
- 170 Elm St
- 143 Plymouth St
- 102 Leon Ct
- 115 Waltham St
- 0 Union Park St
- Lot 6 Way
- Lot 2 Harvard Rd
- 361A County Rd
- 361 County Rd
- 6 Amanda's Way Unit 6
- 134 Crescent St
- 131 Elmer St
- 61 Sawmill Ln
- 61 Sawmill Ln Unit 61
- 0 Thompson St
- 553 Monponsett St
- 161 Winter St Unit 11
Your Personal Tour Guide
Ask me questions while you tour the home.