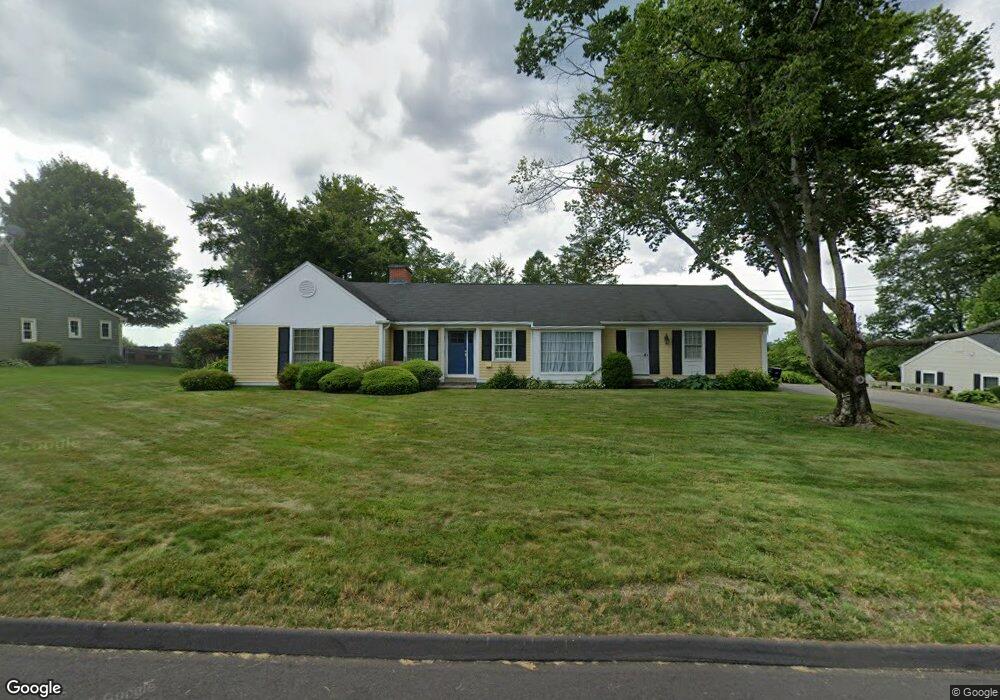
88 Ridge Rd East Longmeadow, MA 01028
Estimated Value: $446,000 - $527,000
3
Beds
2
Baths
1,702
Sq Ft
$281/Sq Ft
Est. Value
About This Home
This home is located at 88 Ridge Rd, East Longmeadow, MA 01028 and is currently estimated at $478,384, approximately $281 per square foot. 88 Ridge Rd is a home located in Hampden County with nearby schools including Meadowbrook Elementary School, Birchland Park Middle School, and East Longmeadow High School.
Ownership History
Date
Name
Owned For
Owner Type
Purchase Details
Closed on
Sep 11, 2020
Sold by
Connor John D
Bought by
Speight Eileen
Current Estimated Value
Purchase Details
Closed on
Sep 2, 2020
Sold by
Goss Lucille Est
Bought by
Connor John D
Purchase Details
Closed on
Mar 23, 1973
Bought by
Goss Lucille M
Create a Home Valuation Report for This Property
The Home Valuation Report is an in-depth analysis detailing your home's value as well as a comparison with similar homes in the area
Home Values in the Area
Average Home Value in this Area
Purchase History
| Date | Buyer | Sale Price | Title Company |
|---|---|---|---|
| Speight Eileen | $330,000 | None Available | |
| Connor John D | $380,000 | None Available | |
| Goss Lucille M | -- | -- |
Source: Public Records
Mortgage History
| Date | Status | Borrower | Loan Amount |
|---|---|---|---|
| Previous Owner | Goss Lucille M | $100,000 | |
| Previous Owner | Goss Lucille M | $100,000 | |
| Previous Owner | Goss Lucille M | $100,000 |
Source: Public Records
Tax History Compared to Growth
Tax History
| Year | Tax Paid | Tax Assessment Tax Assessment Total Assessment is a certain percentage of the fair market value that is determined by local assessors to be the total taxable value of land and additions on the property. | Land | Improvement |
|---|---|---|---|---|
| 2025 | $7,542 | $408,100 | $139,300 | $268,800 |
| 2024 | $7,201 | $388,400 | $139,300 | $249,100 |
| 2023 | $6,833 | $355,900 | $126,600 | $229,300 |
| 2022 | $6,485 | $319,600 | $114,200 | $205,400 |
| 2021 | $6,381 | $303,000 | $105,700 | $197,300 |
| 2020 | $6,112 | $293,300 | $105,700 | $187,600 |
| 2019 | $5,812 | $282,800 | $102,500 | $180,300 |
| 2018 | $5,535 | $269,900 | $102,500 | $167,400 |
| 2017 | $5,498 | $264,700 | $100,700 | $164,000 |
| 2016 | $5,485 | $259,700 | $97,400 | $162,300 |
| 2015 | $5,381 | $259,700 | $97,400 | $162,300 |
Source: Public Records
Map
Nearby Homes
- 15 Lynwood Rd
- 0 Apple Blossom Ln
- 399 Elm St
- 123 Mountainview Rd
- 331 Newhouse St
- 32 Lindsay Rd
- 84 Hanward Hill
- 41 Kerry Dr
- 19 Westminster St
- 12 Poplar St
- 41 Hillside Dr
- 19 Fairview St
- 82 Louis Rd
- 111 Malibu Dr
- 17 Skyridge Ln
- 120 N Main St
- Lot 24 Happy Acres Ln
- 1 Jeffrey Ln
- 75 Marci Ave
- 72 Tanglewood Dr