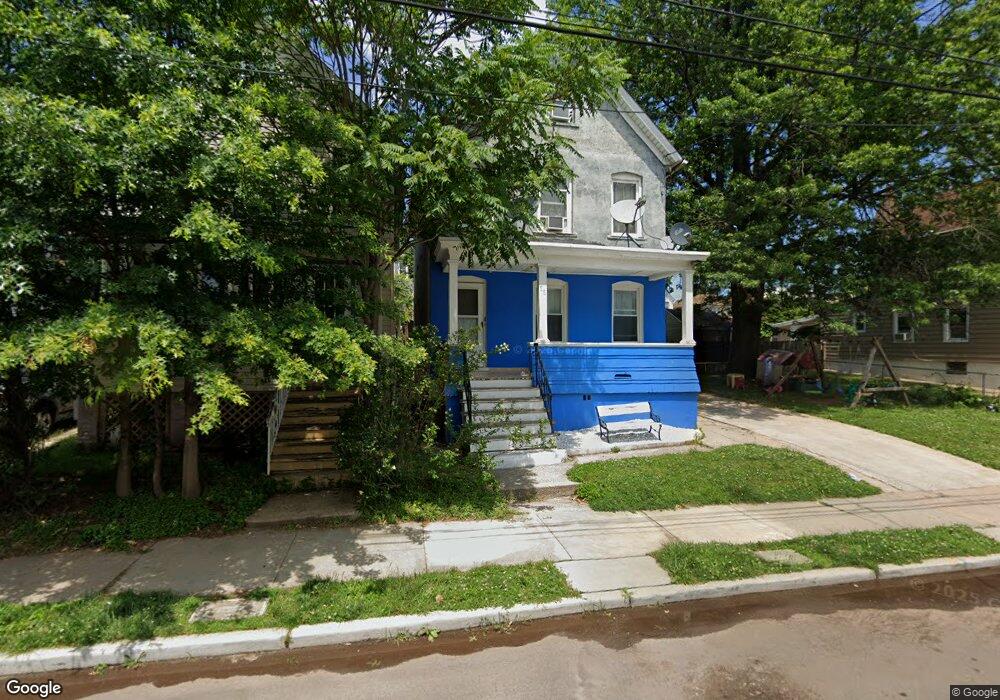
88 Sharot St Carteret, NJ 07008
Estimated Value: $508,057 - $592,000
--
Bed
--
Bath
1,700
Sq Ft
$316/Sq Ft
Est. Value
About This Home
This home is located at 88 Sharot St, Carteret, NJ 07008 and is currently estimated at $537,014, approximately $315 per square foot. 88 Sharot St is a home located in Middlesex County with nearby schools including Carteret High School and St Joseph School.
Ownership History
Date
Name
Owned For
Owner Type
Purchase Details
Closed on
Jun 5, 2006
Sold by
Mcmahon Brian
Bought by
Brito Jose
Current Estimated Value
Home Financials for this Owner
Home Financials are based on the most recent Mortgage that was taken out on this home.
Original Mortgage
$248,000
Outstanding Balance
$146,211
Interest Rate
6.62%
Estimated Equity
$390,803
Purchase Details
Closed on
Jul 10, 2001
Sold by
Lapoint David
Bought by
Mcmahon Brian
Home Financials for this Owner
Home Financials are based on the most recent Mortgage that was taken out on this home.
Original Mortgage
$132,300
Interest Rate
7.18%
Purchase Details
Closed on
Apr 6, 2000
Sold by
Zachik William
Bought by
Lapoint David
Home Financials for this Owner
Home Financials are based on the most recent Mortgage that was taken out on this home.
Original Mortgage
$104,500
Interest Rate
8.26%
Create a Home Valuation Report for This Property
The Home Valuation Report is an in-depth analysis detailing your home's value as well as a comparison with similar homes in the area
Home Values in the Area
Average Home Value in this Area
Purchase History
| Date | Buyer | Sale Price | Title Company |
|---|---|---|---|
| Brito Jose | $310,000 | -- | |
| Mcmahon Brian | $147,000 | -- | |
| Lapoint David | $110,000 | -- |
Source: Public Records
Mortgage History
| Date | Status | Borrower | Loan Amount |
|---|---|---|---|
| Open | Brito Jose | $248,000 | |
| Previous Owner | Mcmahon Brian | $132,300 | |
| Previous Owner | Lapoint David | $104,500 |
Source: Public Records
Tax History Compared to Growth
Tax History
| Year | Tax Paid | Tax Assessment Tax Assessment Total Assessment is a certain percentage of the fair market value that is determined by local assessors to be the total taxable value of land and additions on the property. | Land | Improvement |
|---|---|---|---|---|
| 2025 | $6,892 | $470,600 | $288,800 | $181,800 |
| 2024 | $6,715 | $216,200 | $80,000 | $136,200 |
| 2023 | $6,715 | $216,200 | $80,000 | $136,200 |
| 2022 | $6,529 | $216,200 | $80,000 | $136,200 |
| 2021 | $4,785 | $216,200 | $80,000 | $136,200 |
| 2020 | $6,218 | $216,200 | $80,000 | $136,200 |
| 2019 | $6,038 | $216,200 | $80,000 | $136,200 |
| 2018 | $5,896 | $216,200 | $80,000 | $136,200 |
| 2017 | $5,686 | $216,200 | $80,000 | $136,200 |
| 2016 | $6,046 | $190,900 | $70,000 | $120,900 |
| 2015 | $5,958 | $190,900 | $70,000 | $120,900 |
| 2014 | $5,698 | $190,900 | $70,000 | $120,900 |
Source: Public Records
Map
Nearby Homes