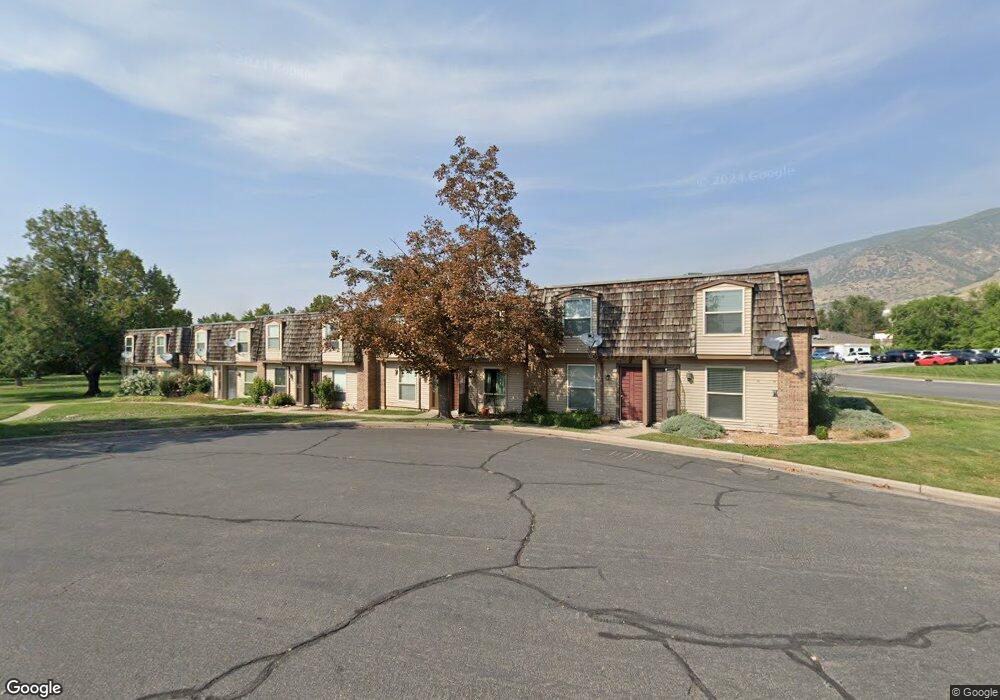
88 W 50 S Unit Q10 Centerville, UT 84014
Estimated Value: $291,000 - $310,000
3
Beds
2
Baths
1,298
Sq Ft
$232/Sq Ft
Est. Value
About This Home
This home is located at 88 W 50 S Unit Q10, Centerville, UT 84014 and is currently estimated at $301,776, approximately $232 per square foot. 88 W 50 S Unit Q10 is a home located in Davis County with nearby schools including J A Taylor Elementary School, Centerville Jr High, and Viewmont High School.
Ownership History
Date
Name
Owned For
Owner Type
Purchase Details
Closed on
Nov 8, 2024
Sold by
Sullivan Eldina and Sullivan Andrew
Bought by
Nielsen Stewart and Nielsen Kalen
Current Estimated Value
Home Financials for this Owner
Home Financials are based on the most recent Mortgage that was taken out on this home.
Original Mortgage
$295,850
Outstanding Balance
$292,271
Interest Rate
6.08%
Mortgage Type
New Conventional
Estimated Equity
$9,505
Purchase Details
Closed on
Aug 24, 2018
Sold by
Tatarevic Eldina
Bought by
Sullivan Eldina and Sullivan Andrew
Home Financials for this Owner
Home Financials are based on the most recent Mortgage that was taken out on this home.
Original Mortgage
$115,000
Interest Rate
4.5%
Mortgage Type
New Conventional
Purchase Details
Closed on
May 28, 2013
Sold by
Ivins Christopher Redd and Ivins Dianna
Bought by
Tatarevic Eldina
Home Financials for this Owner
Home Financials are based on the most recent Mortgage that was taken out on this home.
Original Mortgage
$89,600
Interest Rate
3.38%
Mortgage Type
New Conventional
Purchase Details
Closed on
Dec 18, 2008
Sold by
Hendricks Rachel
Bought by
Ivins Christopher Redd and Ivins Dianna
Home Financials for this Owner
Home Financials are based on the most recent Mortgage that was taken out on this home.
Original Mortgage
$121,900
Interest Rate
5.97%
Mortgage Type
Purchase Money Mortgage
Purchase Details
Closed on
Dec 6, 2006
Sold by
Bales Scott A
Bought by
Hendricks Rachel
Home Financials for this Owner
Home Financials are based on the most recent Mortgage that was taken out on this home.
Original Mortgage
$106,500
Interest Rate
6.38%
Mortgage Type
Purchase Money Mortgage
Purchase Details
Closed on
Jun 16, 2003
Sold by
Griffin Debra Lynn
Bought by
Bales Scott
Purchase Details
Closed on
Jan 30, 1998
Sold by
Drage Kenneth W
Bought by
Drage Kenneth W and Griffin Debra Lynn
Create a Home Valuation Report for This Property
The Home Valuation Report is an in-depth analysis detailing your home's value as well as a comparison with similar homes in the area
Home Values in the Area
Average Home Value in this Area
Purchase History
| Date | Buyer | Sale Price | Title Company |
|---|---|---|---|
| Nielsen Stewart | -- | Fidelity National Title | |
| Nielsen Stewart | -- | Fidelity National Title | |
| Sullivan Eldina | -- | Meridian Title | |
| Tatarevic Eldina | -- | Advanced Title Ins A | |
| Ivins Christopher Redd | -- | Title One Inc | |
| Hendricks Rachel | -- | Equity Title Ins Agency Inc | |
| Bales Scott | -- | United Title Services | |
| Drage Kenneth W | -- | Bonneville Title Company Inc |
Source: Public Records
Mortgage History
| Date | Status | Borrower | Loan Amount |
|---|---|---|---|
| Open | Nielsen Stewart | $295,850 | |
| Closed | Nielsen Stewart | $17,751 | |
| Closed | Nielsen Stewart | $295,850 | |
| Previous Owner | Sullivan Eldina | $115,000 | |
| Previous Owner | Tatarevic Eldina | $89,600 | |
| Previous Owner | Ivins Christopher Redd | $121,900 | |
| Previous Owner | Hendricks Rachel | $106,500 |
Source: Public Records
Tax History Compared to Growth
Tax History
| Year | Tax Paid | Tax Assessment Tax Assessment Total Assessment is a certain percentage of the fair market value that is determined by local assessors to be the total taxable value of land and additions on the property. | Land | Improvement |
|---|---|---|---|---|
| 2025 | $1,587 | $151,800 | $0 | $151,800 |
| 2024 | $1,419 | $138,050 | $0 | $138,050 |
| 2023 | $1,382 | $243,000 | $0 | $243,000 |
| 2022 | $1,369 | $132,550 | $33,000 | $99,550 |
| 2021 | $1,340 | $202,000 | $60,000 | $142,000 |
| 2020 | $1,161 | $175,000 | $41,600 | $133,400 |
| 2019 | $1,087 | $160,000 | $40,000 | $120,000 |
| 2018 | $956 | $139,000 | $34,000 | $105,000 |
| 2016 | $735 | $59,400 | $12,650 | $46,750 |
| 2015 | $648 | $49,390 | $12,650 | $36,740 |
| 2014 | $862 | $67,293 | $18,333 | $48,960 |
| 2013 | -- | $62,202 | $14,025 | $48,177 |
Source: Public Records
Map
Nearby Homes