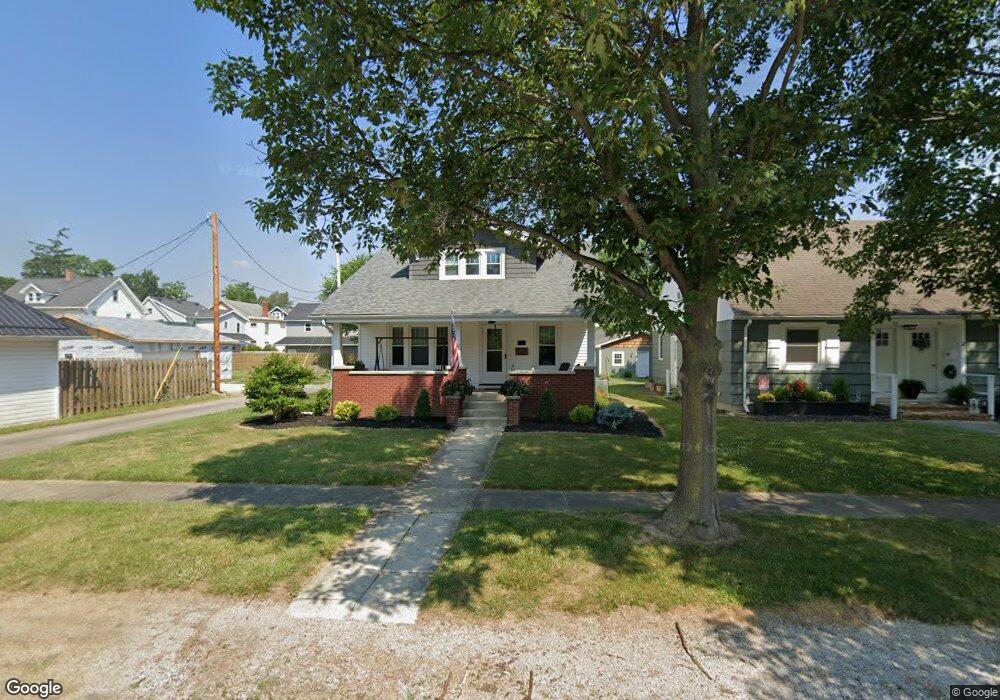
88 Warren St Tiffin, OH 44883
Estimated Value: $266,000 - $410,000
3
Beds
2
Baths
2,332
Sq Ft
$156/Sq Ft
Est. Value
About This Home
This home is located at 88 Warren St, Tiffin, OH 44883 and is currently estimated at $364,956, approximately $156 per square foot. 88 Warren St is a home located in Seneca County with nearby schools including Columbian High School, Bridges Community Academy, and Calvert High School.
Ownership History
Date
Name
Owned For
Owner Type
Purchase Details
Closed on
Jan 5, 2018
Sold by
Croghan Colonial Bank
Bought by
Johnson Alexander Arthur and Johnson Lindsay Sue
Current Estimated Value
Home Financials for this Owner
Home Financials are based on the most recent Mortgage that was taken out on this home.
Original Mortgage
$199,500
Outstanding Balance
$168,268
Interest Rate
3.92%
Mortgage Type
New Conventional
Estimated Equity
$196,688
Purchase Details
Closed on
Apr 17, 1997
Sold by
Murray Mary Ley
Bought by
Murray Mary Ley Trustee
Purchase Details
Closed on
Apr 6, 1995
Sold by
Hohman Eugene
Bought by
Murray Mary Ley
Purchase Details
Closed on
Jun 6, 1990
Create a Home Valuation Report for This Property
The Home Valuation Report is an in-depth analysis detailing your home's value as well as a comparison with similar homes in the area
Home Values in the Area
Average Home Value in this Area
Purchase History
| Date | Buyer | Sale Price | Title Company |
|---|---|---|---|
| Johnson Alexander Arthur | $210,000 | Assured Title | |
| Murray Mary Ley Trustee | -- | -- | |
| Murray Mary Ley | $18,500 | -- | |
| -- | -- | -- |
Source: Public Records
Mortgage History
| Date | Status | Borrower | Loan Amount |
|---|---|---|---|
| Open | Johnson Alexander Arthur | $199,500 |
Source: Public Records
Tax History Compared to Growth
Tax History
| Year | Tax Paid | Tax Assessment Tax Assessment Total Assessment is a certain percentage of the fair market value that is determined by local assessors to be the total taxable value of land and additions on the property. | Land | Improvement |
|---|---|---|---|---|
| 2024 | $4,339 | $116,820 | $13,250 | $103,570 |
| 2023 | $4,340 | $116,820 | $13,250 | $103,570 |
| 2022 | $3,703 | $91,800 | $12,700 | $79,100 |
| 2021 | $3,724 | $91,800 | $12,700 | $79,100 |
| 2020 | $3,741 | $91,802 | $12,698 | $79,104 |
| 2019 | $3,199 | $77,711 | $11,043 | $66,668 |
| 2018 | $3,276 | $77,711 | $11,043 | $66,668 |
| 2017 | $2,834 | $77,711 | $11,043 | $66,668 |
| 2016 | $2,751 | $78,940 | $11,043 | $67,897 |
| 2015 | $2,714 | $78,940 | $11,043 | $67,897 |
| 2014 | $2,571 | $78,940 | $11,043 | $67,897 |
| 2013 | $2,800 | $78,940 | $11,043 | $67,897 |
Source: Public Records
Map
Nearby Homes