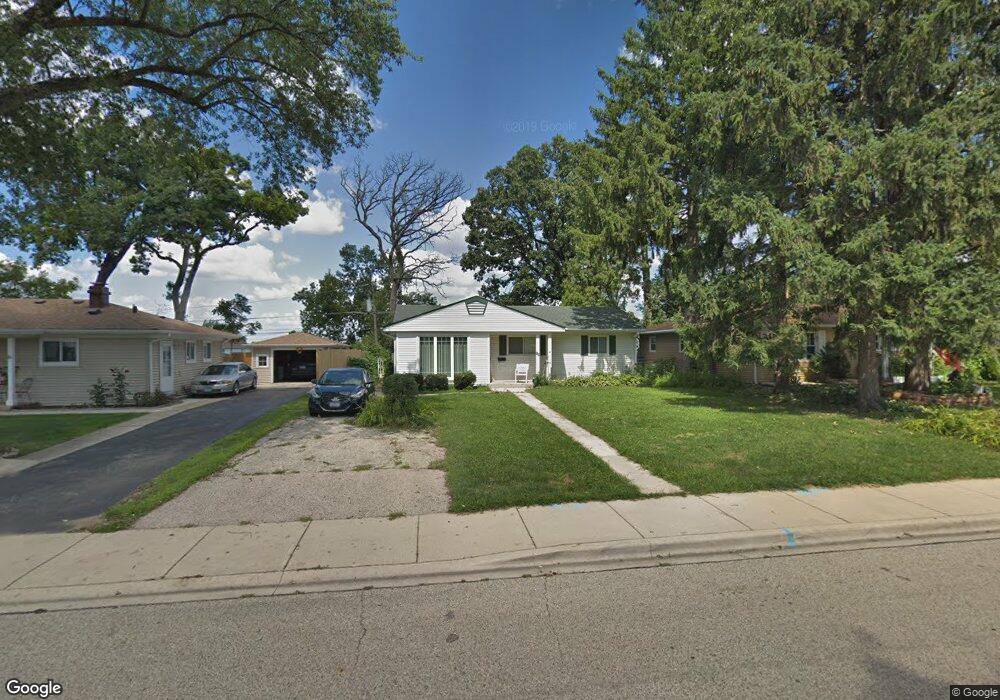
88 Wren Rd Carpentersville, IL 60110
Estimated Value: $232,000 - $256,000
4
Beds
--
Bath
1,016
Sq Ft
$235/Sq Ft
Est. Value
About This Home
This home is located at 88 Wren Rd, Carpentersville, IL 60110 and is currently estimated at $238,848, approximately $235 per square foot. 88 Wren Rd is a home located in Kane County with nearby schools including Meadowdale Elementary School, Crescent City Grade School, and Carpentersville Middle School.
Ownership History
Date
Name
Owned For
Owner Type
Purchase Details
Closed on
Jun 27, 2022
Sold by
Provisions Of A Trust and Webb Mary Ellen
Bought by
Webb Mary Ellen
Current Estimated Value
Home Financials for this Owner
Home Financials are based on the most recent Mortgage that was taken out on this home.
Original Mortgage
$50,000
Outstanding Balance
$47,683
Interest Rate
5.37%
Mortgage Type
Balloon
Estimated Equity
$191,165
Purchase Details
Closed on
Dec 16, 2014
Sold by
Webb Mary Ellan
Bought by
Webb Mary Ellen
Purchase Details
Closed on
May 24, 2002
Sold by
Webb Mary Ellen
Bought by
Webb Mary Ellen
Purchase Details
Closed on
Mar 4, 2002
Sold by
Webb Robert T
Bought by
Webb Mary Ellen
Purchase Details
Closed on
Mar 1, 2002
Sold by
Webb Marion L and Tapp Penny L
Bought by
Webb Mary Ellen
Purchase Details
Closed on
Feb 28, 2002
Sold by
Madigan Roberta B A
Bought by
Webb Mary Ellen
Create a Home Valuation Report for This Property
The Home Valuation Report is an in-depth analysis detailing your home's value as well as a comparison with similar homes in the area
Home Values in the Area
Average Home Value in this Area
Purchase History
| Date | Buyer | Sale Price | Title Company |
|---|---|---|---|
| Webb Mary Ellen | -- | None Listed On Document | |
| Webb Mary Ellen | -- | None Available | |
| Webb Mary Ellen | -- | -- | |
| Webb Mary Ellen | -- | -- | |
| Webb Mary Ellen | -- | -- | |
| Webb Mary Ellen | -- | -- | |
| Webb Mary Ellen | -- | -- | |
| Webb Mary Ellen | -- | -- |
Source: Public Records
Mortgage History
| Date | Status | Borrower | Loan Amount |
|---|---|---|---|
| Open | Webb Mary Ellen | $50,000 |
Source: Public Records
Tax History Compared to Growth
Tax History
| Year | Tax Paid | Tax Assessment Tax Assessment Total Assessment is a certain percentage of the fair market value that is determined by local assessors to be the total taxable value of land and additions on the property. | Land | Improvement |
|---|---|---|---|---|
| 2024 | $256 | $64,046 | $12,553 | $51,493 |
| 2023 | $284 | $57,627 | $11,295 | $46,332 |
| 2022 | $730 | $46,980 | $11,295 | $35,685 |
| 2021 | $759 | $44,359 | $10,665 | $33,694 |
| 2020 | $766 | $43,361 | $10,425 | $32,936 |
| 2019 | $793 | $41,163 | $9,897 | $31,266 |
| 2018 | $832 | $37,055 | $9,701 | $27,354 |
| 2017 | $860 | $34,663 | $9,075 | $25,588 |
| 2016 | $922 | $29,981 | $8,787 | $21,194 |
| 2015 | -- | $23,640 | $8,234 | $15,406 |
| 2014 | -- | $21,383 | $8,007 | $13,376 |
| 2013 | -- | $22,037 | $8,252 | $13,785 |
Source: Public Records
Map
Nearby Homes