Estimated Value: $343,000 - $387,000
4
Beds
2
Baths
1,485
Sq Ft
$246/Sq Ft
Est. Value
About This Home
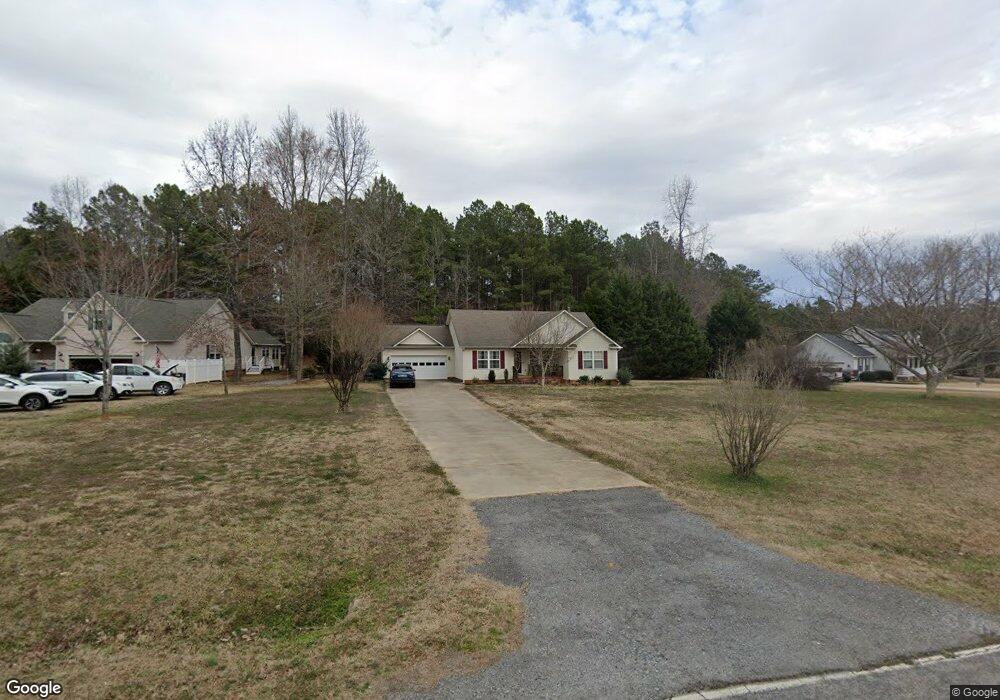
This home is located at 880 Chambers Rd, York, SC 29745 and is currently estimated at $364,676, approximately $245 per square foot. 880 Chambers Rd is a home located in York County with nearby schools including Hunter Street Elementary School, York Intermediate School, and York Middle School.
Ownership History
Date
Name
Owned For
Owner Type
Purchase Details
Closed on
Mar 22, 2010
Sold by
Federal Home Loan Mortgage Corporation
Bought by
Bursey Diane K
Current Estimated Value
Home Financials for this Owner
Home Financials are based on the most recent Mortgage that was taken out on this home.
Original Mortgage
$70,000
Outstanding Balance
$46,119
Interest Rate
4.94%
Mortgage Type
New Conventional
Estimated Equity
$318,557
Purchase Details
Closed on
Dec 14, 2009
Sold by
Xiong Yen and Her Kao
Bought by
Federal Home Loan Mortgage Corp
Purchase Details
Closed on
Jan 30, 2006
Sold by
Kcl Builders Inc
Bought by
Xiong Yeng and Her Kao
Home Financials for this Owner
Home Financials are based on the most recent Mortgage that was taken out on this home.
Original Mortgage
$124,880
Interest Rate
6.14%
Mortgage Type
New Conventional
Purchase Details
Closed on
Jul 11, 2005
Sold by
Tan Rick Builders Inc
Bought by
Kcl Builders Inc
Create a Home Valuation Report for This Property
The Home Valuation Report is an in-depth analysis detailing your home's value as well as a comparison with similar homes in the area
Home Values in the Area
Average Home Value in this Area
Purchase History
| Date | Buyer | Sale Price | Title Company |
|---|---|---|---|
| Bursey Diane K | $140,000 | -- | |
| Federal Home Loan Mortgage Corp | $50,000 | -- | |
| Xiong Yeng | $156,100 | None Available | |
| Kcl Builders Inc | $101,052 | -- |
Source: Public Records
Mortgage History
| Date | Status | Borrower | Loan Amount |
|---|---|---|---|
| Open | Bursey Diane K | $70,000 | |
| Previous Owner | Xiong Yeng | $124,880 |
Source: Public Records
Tax History
| Year | Tax Paid | Tax Assessment Tax Assessment Total Assessment is a certain percentage of the fair market value that is determined by local assessors to be the total taxable value of land and additions on the property. | Land | Improvement |
|---|---|---|---|---|
| 2025 | $1,026 | $7,777 | $1,261 | $6,516 |
| 2024 | $820 | $6,762 | $1,480 | $5,282 |
| 2023 | $1,188 | $6,762 | $1,480 | $5,282 |
| 2022 | $1,191 | $6,762 | $1,480 | $5,282 |
| 2021 | -- | $6,762 | $1,480 | $5,282 |
| 2020 | $1,189 | $6,762 | $0 | $0 |
| 2019 | $1,074 | $5,880 | $0 | $0 |
| 2018 | $1,034 | $5,880 | $0 | $0 |
| 2017 | $983 | $5,880 | $0 | $0 |
| 2016 | $967 | $5,880 | $0 | $0 |
| 2014 | $939 | $5,880 | $1,400 | $4,480 |
| 2013 | $939 | $6,120 | $1,400 | $4,720 |
Source: Public Records
Map
Nearby Homes
- 1241 State Road S-46-817
- 204 Vanderbilt Dr
- 2140 Dolly Rose Dr
- 588 Mahagony Rd
- 596 Mahagony Rd
- 592 Mahagony Rd
- 1489 S Paraham Rd
- 2225 Old McKinney Rd
- 264 Court House Ave
- 1821 Sherrer Rd
- 364 Paraham Rd S
- 7591 Charlotte Hwy
- 610 Osteen Rd
- 6180 Mt Gallant Rd
- 2098 Mallard Creek Dr
- 6045 C Campbell Rd
- 122 S Shiloh Rd
- 214 Hedgecrest Ln
- 564 S Shiloh Rd
- 1079 B J Jackson Rd Unit HWY195
- 894 Chambers Rd
- 886 Chambers Rd
- 908 Chambers Rd
- 842 Chambers Rd
- 925 Chambers Rd
- 867 Chambers Rd
- 936 Chambers Rd
- 814 Chambers Rd
- 820 Chambers Rd
- 806 Chambers Rd
- 956 Chambers Rd
- 1088 State Road S-46-817
- 821 Chambers Rd
- 1108 State Road S-46-817
- 953 Chambers Rd
- 964 Chambers Rd
- 799 Chambers Rd
- 790 Chambers Rd
- 18.06 AC Chambers Rd Unit 7
- 36 AC Chambers Rd Unit 4 & 7
Your Personal Tour Guide
Ask me questions while you tour the home.